風蕭蕭_Frank
以文會友


中國在不斷變化的經濟秩序中的下一步行動
https://www.rbcwealthmanagement.com/en-asia/insights/chinas-next-act-in-a-changing-economic-order
隨著各國逐漸擺脫冷戰後激烈的全球化時代,世界製造業強國將如何適應新的經濟範式?
作者:段茉莉,2023 年 8 月 14 日
加拿大皇家銀行財富管理公司的“天壤之別:逆全球化迫在眉睫的風險與機遇”係列探討了遠離全球化的趨勢及其對投資者、經濟體和金融市場的影響。 該係列的最新專題聚焦於中國在全球供應鏈和製造業中的獨特作用。
由於供應鏈高度複雜且相互關聯,西方與中國脫鉤是不現實的。 中國通過向供應鏈上遊轉移,正在贏得全球製造業的市場份額。
中國過去已經展現出克服技術限製影響的能力。 中國龐大的製造規模和完善的供應鏈應該為未來的技術創新奠定基礎。
十多年前,中國開始從低端、勞動密集型零部件製造轉向高科技、全係列產品製造。
中國國內市場太大,跨國公司不容忽視。 但我們認為跨國公司需要確定如何在中國尋求機遇,同時有效管理風險。
我們所目睹的供應鏈轉型是國際貿易和商業的自然演變。 我們相信,中國能夠像現代曆史上許多其他國家一樣成功度過這一時期。
新聞頭條經常強調地緣政治和新冠肺炎 (COVID-19) 疫情在推動西方跨國公司將供應鏈遷出中國方麵所發揮的作用。 這反過來又助長了一種敘事,強調這些因素是全球供應鏈和中國製造業變革的主要催化劑。
隨著貿易流動從激烈的全球化時期轉向更加分散的時期,地緣政治因素確實發揮了作用。 各國政府正在促進和激勵製造業的在岸和友岸外包,許多跨國公司正在尋求供應鏈多元化。
然而,對於中國來說,我們認為情況比主流頭條新聞描述的更為複雜,也沒有那麽悲觀。
首先,我們認為,全球供應鏈的高度複雜性,加上中國工業部門的龐大規模和製造能力,使得許多跨國公司短期內與中國徹底決裂是不可取的、也不現實的。
其次,多年來,中國製造業和全球供應鏈的演變是為了應對與當前中美貿易和政治摩擦無關的力量。
即使發達國家的本土化和友好型外包趨勢加快,我們認為中國在四十多年來與眾多跨國公司建立的互利關係將使中國融入全球經濟和投資格局。
供應鏈的相互關聯性和複雜性遠遠超出想象
生產複雜產品的公司通常擁有四層或多層數千家供應商。
根據谘詢公司麥肯錫公司的數據,科技公司擁有 125 家一級供應商(即最終產品的直接供應商或用於創建最終產品的完整組件),平均而言,所有級別的供應商超過 7,000 家。
一家汽車製造商通常擁有約 250 家一級供應商,但整個供應鏈的數量已增加至 18,000 家。
全球供應鏈的複雜性常常導致擁有上遊產品或材料的國家的公司之間相互依賴。
例如,隨著東南亞10個東盟*國家的製造能力不斷增強,它們與中國製造供應鏈的聯係也更加緊密。 2012年,東盟成員國從中國進口了1770億美元的商品。在短短10年內,這一數字到2021年增加了一倍多,達到3880億美元。
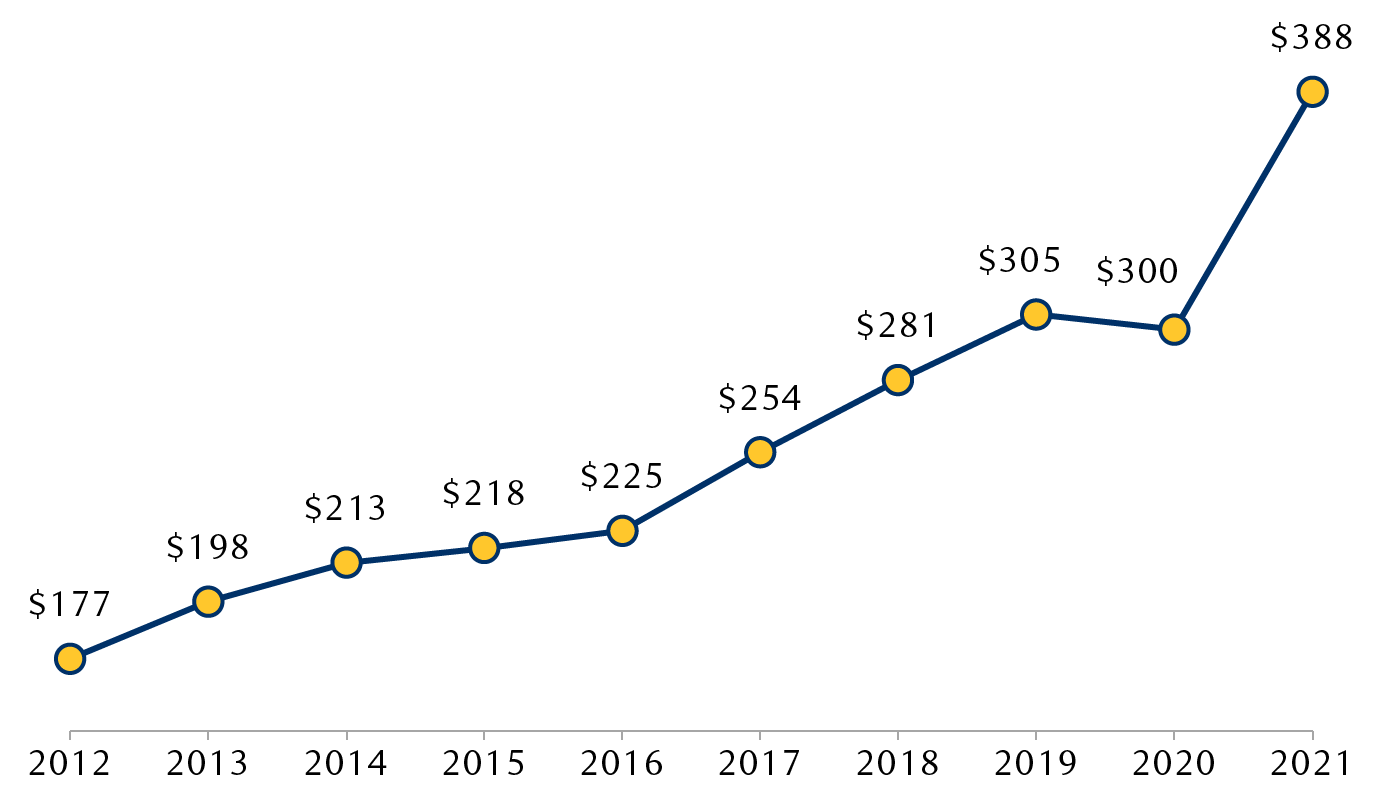
過去十年中國對東盟的進口增長了一倍多美元(十億)
2012年至2021年東盟國家從中國的進口額
折線圖顯示了2012年至2021年期間東盟國家從中國的進口額。該圖顯示,多年來進口額穩步增長,從2012年的1770億美元增至2021年的3880億美元,翻了一倍多。
*東南亞國家聯盟 (ASEAN) 是一個區域性政府間組織,由 10 個成員國組成:印度尼西亞、馬來西亞、菲律賓、新加坡、泰國、文萊、柬埔寨、老撾、緬甸和越南。
資料來源 – Statista、加拿大皇家銀行財富管理; 截至 2021 年的年度數據
東盟地區仍然高度依賴中國的投入和資本貨物,這對這些國家製造的產品至關重要。 如果跨國公司希望未來幾年在該地區生產更多商品,我們認為中國生產也將在供應鏈中發揮有意義的作用。
中國龐大的製造業足跡
“中國製造”的標簽對於很多人來說並不陌生,但中國製造的整體規模和範圍可能仍然被低估。
中國製造業規模連續十多年位居世界第一。 據聯合國稱,2021年,中國製造業產值占全球的30%。 相比之下,歐盟總共占16%,美國占15%,日本和德國分別占6%和5%。
目前,中國是世界上唯一符合聯合國統計參考分類係統所有製造業相關部分標準的國家。 這說明了中國生產能力的廣泛性。 許多行業的稱號位居世界第一。
中國作為知識產權領導者的崛起也有助於其製造基地的成熟和發展。
2019年,中國超越美國,成為根據世界知識產權組織(WIPO)《專利合作條約》申請國際專利的最大來源國。
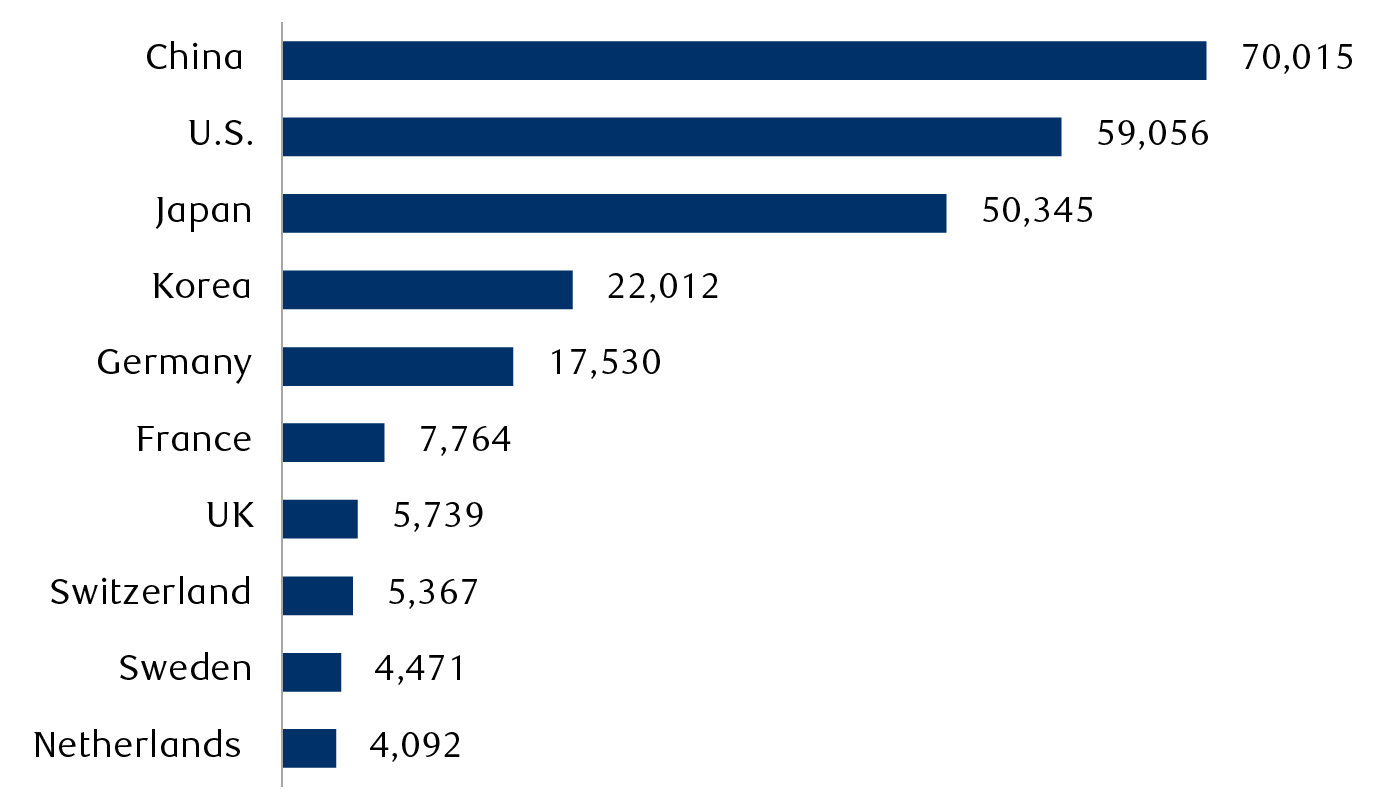
2022年中國提交專利合作條約申請最多
根據《專利合作條約》提交專利申請最多的國家
條形圖顯示根據世界知識產權組織《專利合作條約》(PCT) 提交專利申請最多的前 10 個國家。 中國申請人提交了 70,015 件 PCT 申請,其次是美國(59, 056)、日本(50,345)、韓國(22,012)、德國(17,530)、法國(7,764)、英國(5,739)、瑞士(5,367) 、瑞典(4,471)和荷蘭(4,092)。
資料來源 – 世界知識產權組織統計數據庫(2023 年 2 月),加拿大皇家銀行財富管理
隨著中國從低成本製造中心轉變為越來越注重創新和複雜製造技術的製造中心,我們認為該國將保持其製造主導地位,同時進軍電動汽車等新興戰略領域。 )、電信、生物工程、人工智能(AI)等領域。
製造能力在技術上變得更加先進
過去幾十年來,中國在各個行業建立了全麵的供應鏈,這在很大程度上得益於跨國公司和戰略合資企業的本土化進程。 這些合作使中國獲得了技術和訣竅,並為自身的技術創新奠定了基礎。
近年來,西方開始對中國獲取人工智能、量子計算和先進半導體等關鍵技術實施限製,引發了人們對中國能否進一步向供應鏈上遊邁進並實現其所謂的“技術自力更生”的能力的擔憂。 ” 目標。
這可能會給中國的技術發展帶來挑戰,並可能減慢其發展速度。 然而,重要的是要記住,中國過去已經表現出克服技術限製影響的能力。 天宮空間站和中國電動汽車的開發就是兩個例子。
天宮:從旁觀者到獨立航天強國
國際空間站(ISS)是美國、歐洲、俄羅斯、加拿大和日本之間的合作項目。 截至 2023 年 6 月,它已接待了來自 21 個不同國家的宇航員。
2011年,美國國會通過了一項由總統簽署的法律,禁止美國國家航空航天局(NASA)向中國提供資助或與中國進行直接的雙邊合作,從而有效阻止了中國加入國際空間站。
作為回應,中國在接下來的十年裏開發和發射單獨的模塊,以在 2023 年完成自己的永久空間站,稱為“天宮”。
天宮建立了中國在太空的獨立存在。 它使中國能夠開展先進的科學研究,代表著中國作為全球太空強國邁出了改變遊戲規則的重要一步。 隨著國際空間站計劃於 2031 年退役,天宮將成為唯一正在運行的空間站。
汽車工業:從新興產業到高科技產業
過去幾十年發展起來的全麵供應鏈為中國汽車行業的技術進步鋪平了道路。
一般的經驗法則是,特定製造領域的生產規模越大,就越容易提高生產效率、產品質量和技術。
中國通過製定國家政策和資金支持、培養國內人才以及與其他國家建立戰略互利聯盟來尋求克服技術障礙。
中國汽車工業的發展,特別是電動汽車技術的快速進步,讓我們可以深入了解該國擴大生產規模進入高科技製造業的能力。
20世紀70年代末和80年代政府改革開放後,中國汽車行業經曆了快速增長。 該行業與大眾、通用和本田等外國汽車製造商成立了合資企業。
起初,中國汽車工業嚴重依賴國外技術,特別是在內燃機汽車的核心部件發動機和變速箱設計方麵。
隨著時間的推移,中國發展了廣泛的汽車供應鏈和製造能力,同時積極鼓勵技術工程人才的發展。
2000年代初,中國開始探索新能源汽車。 2010 年代,政府出台了一係列旨在支持研發 (R&D) 和鼓勵電動汽車采用的政策。
傳統汽車生產中使用的許多技術和生產工藝可以轉移到電動汽車製造中。 同時,電動汽車的核心部件和技術包括電池、電動機和電控係統,與傳統內燃機汽車的組成部件和技術有很大不同。
憑借強大的製造技術和支持性的公共激勵措施,中國汽車工業能夠擺脫傳統化石燃料動力傳動係統的技術限製,並進軍更先進、更清潔的技術。
Patent Result 最近的一份報告強調了中國在電動汽車充電專利方麵的領先地位。 2010年至2022年,中國企業在該領域提交了41,011件專利申請,比日本高出52%,是美國電動汽車充電專利數量的近三倍。 中國現已超過日本、美國和歐洲,成為最大的新型電動汽車出口國。
中國從勞動密集型製造業轉型
與當前中美地緣政治摩擦無關的其他因素也有助於改變中國的供應鏈和製造流程。 這些大多源於中國自身的經濟發展。
過去20年來,隨著中國經濟的顯著增長,勞動力成本增加了一倍多,迫使鞋類和服裝製造等勞動密集型產業轉移到勞動力更便宜的國家——很多情況下是轉移到東盟國家。
這個過程可以追溯到十多年前中國開始製造業升級的時候。
一些勞動密集型產業開始從沿海製造業中心轉移到欠發達的內陸城市和省份。
後來,隨著那裏勞動力成本的上升,生產開始向國外轉移,中資工廠在東盟國家湧現。 中國製造業在該地區的投資範圍包括紡織、消費電子產品、電動汽車供應鏈、製藥等。
截至2021年,中國以140億美元成為東盟地區第三大國際直接投資來源國,僅次於美國的400億美元和東盟國家相互投資的210億美元。
供應鏈多元化:低於宣傳的水平
盡管供應鏈在一定程度上遠離中國,但這種變化並不像人們想象的那麽重要。 電子和機械行業就是一個很好的例子,它是全球貿易中最大的商品類別。
該行業的出口以中國為主,但近年來已向東盟國家轉移。 與保爾森基金會有聯係的美國智庫Macro Polo的一項研究顯示,2018年至2021年,中國對美國的電子產品出口額下降了10個百分點。大部分缺口被東盟國家填補。 美國前財政部長漢克·保爾森)。
人們很容易得出這樣的結論:中國在全球製造業中的地位正在輸給東盟國家。 然而,數據卻講述了不同的故事。 東盟國家在全球製造業中的收益相對較小; 該地區的市場份額從 2010 年的 3% 左右小幅上升到 2021 年的 5% 左右,而同期中國的份額從 20% 上升到 30%。
數據告訴我們,雖然部分製成品的最終組裝可能已從中國轉移到東盟,但中國的整體製造能力仍然較高。
中國正在逐步用更先進、更高附加值的製造業取代勞動密集型產業。 這種結構轉型的典型例子是新能源汽車、太陽能電池和鋰電池這三種可再生能源產品的出口繁榮。
隨著中國向供應鏈上遊移動,其經濟變得更加複雜
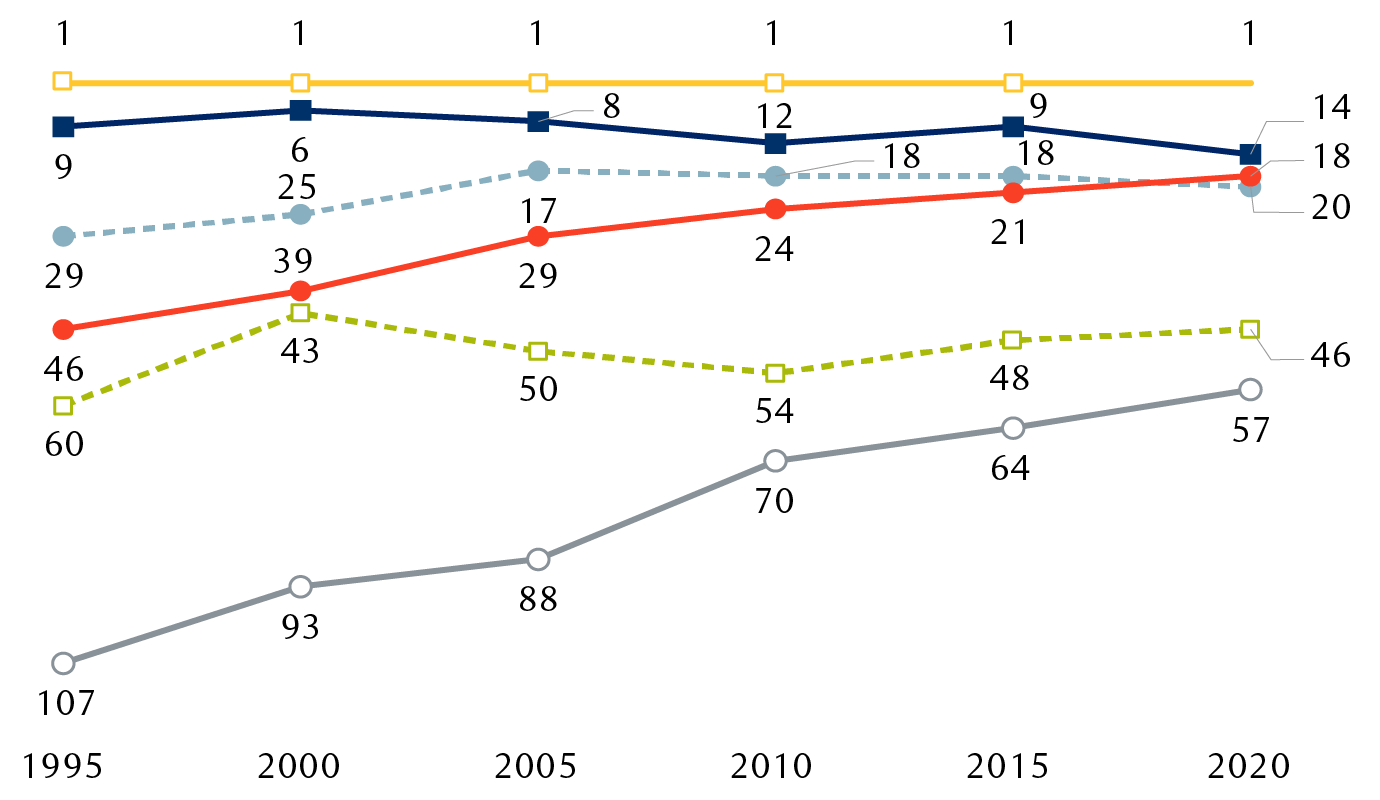
哈佛經濟複雜性指數排名; “1”是最複雜的
哈佛經濟複雜性指數排名
折線圖顯示了1995年至2020年各國(日本、美國、中國、墨西哥、印度和越南)複雜性排名。日本自1995年以來一直排名第一。中國的排名從1995年的第46位提升至2020年的第18位 美國排名多年來略有下降,2020年排名第14位,墨西哥1995年排名第29位,2020年上升至第20位。印度和越南排名分別從第60位上升至第46位,從第107位上升至第57位。
日本
我們。
中國
墨西哥
印度
越南
注:經濟發展需要生產性知識的積累及其在更廣泛、更複雜的行業中的運用。 哈佛增長實驗室的經濟複雜性指數(ECI)評估一個國家的生產知識狀況。 隨著一國出口數量和複雜程度的增加,該國的ECI趨向於“1”; 例如,在該數據中,日本的 ECI 一直最高,為 1,而越南目前最低,為 57,盡管其得分一直在提高。
資料來源 – 哈佛增長實驗室、加拿大皇家銀行財富管理
與此同時,中國已經改變了貿易模式,擺脫了依賴供應材料或零部件的加工貿易。 曆史上,製造商一直采用加工貿易來尋求專業投入或降低勞動力成本。 其占中國出口總額的比重已從2000年的55%下降至20%左右。與此同時,製成品出口單位價值持續上升,表明產業升級正在進行。
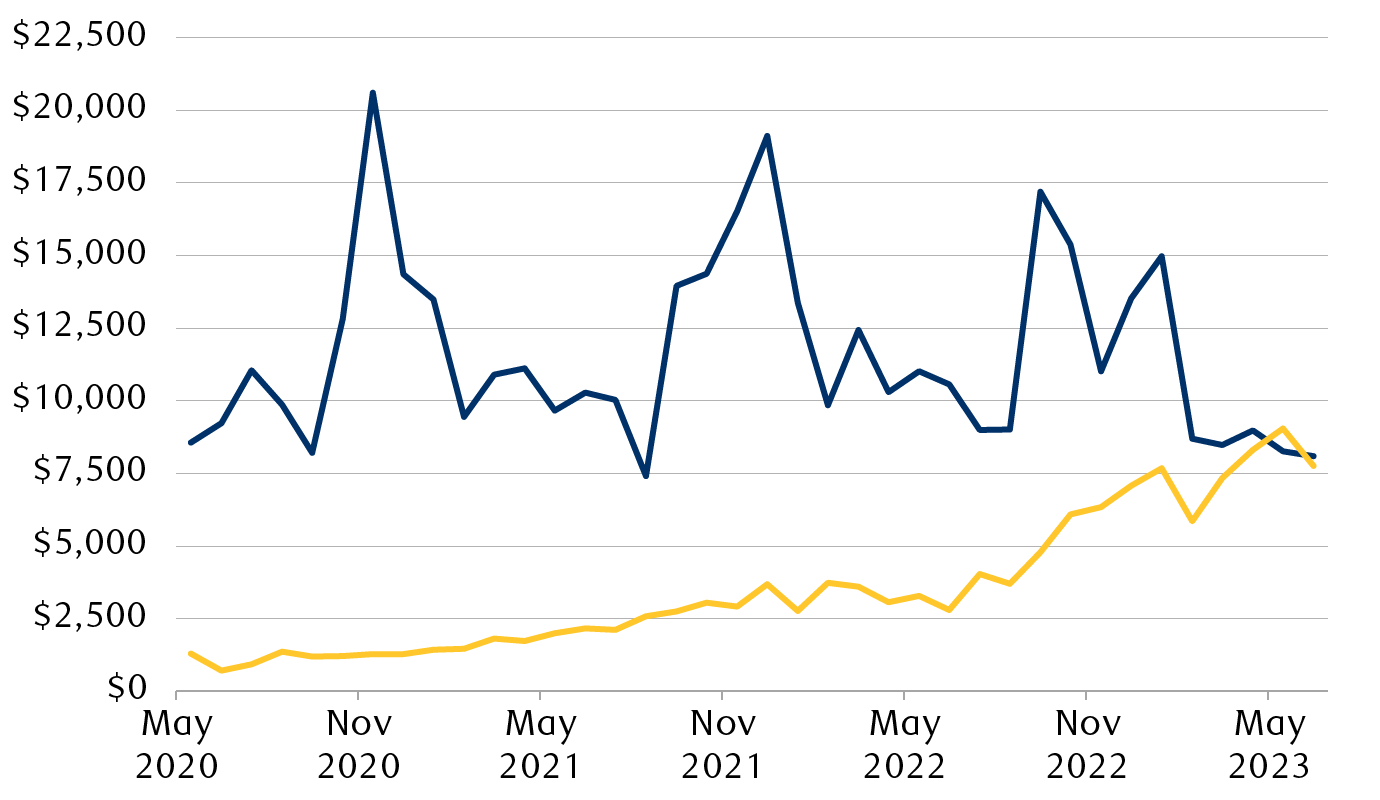
隨著中國製造業變得更加複雜,汽車出口額激增
美元(百萬)
2020年5月至2023年5月中國手機和汽車月度出口額
折線圖顯示了2020年5月至2023年5月中國手機和汽車的月度出口額。2020年5月汽車出口總額為13.05億美元,並且一直在增長(最新讀數為77.58億美元)。 汽車出口額現已趕上手機(最新數據為81.01億美元),手機是傳統上重要的出口領域。
手機 汽車
資料來源 – 加拿大皇家銀行財富管理公司、彭博社; 截至 2023 年 6 月的月度數據
中國仍將是一個有吸引力的投資目的地嗎?
20世紀70年代和80年代改革開放後,中國與跨國公司建立了互利共贏的關係。 中國從跨國公司那裏獲得了技術和管理知識,而這些公司在中國享有較低的生產成本和較高的利潤(我們認為這提振了股價),以及進入中國龐大的國內市場的機會。
然而,最近,跨國公司開始重新評估在中國的商業環境及其投資計劃。
中國美國商會的一項調查顯示,將中國視為三大投資重點之一的跨國公司比例從2012年的78%下降到2022年的45%。
中國政策環境的不確定性、跨國公司對經濟增長放緩的預期以及中美經濟和政治關係的整體不確定性是受訪者最關心的問題。 其他擔憂源於中國人口老齡化以及該國獲得關鍵技術的限製。 來自中國國內企業的日益激烈的競爭也給跨國公司帶來了挑戰。
盡管存在這些擔憂,但我們認為,中國仍然提供著不容忽視的機遇。
由於中國GDP占全球總量的18%,我們認為僅中國經濟規模就值得跨國公司關注。 該國擁有世界上最大的中等收入階層。 據麥肯錫預測,到2030年,超過40%至50%的中國人口將居住在高收入城市。
在汽車、奢侈品、工業設備等領域,中國市場貢獻了全球收入的25%至40%。 我們認為,這使得跨國公司很難選擇不參與中國市場的競爭。
英特爾首席執行官帕特·基辛格(Pat Gelsinger)承認,保持進入中國半導體市場的機會非常重要,因為它提供了收入機會,而且這些收入有助於為英特爾的研發和內部擴張提供資金。
在 7 月份阿斯彭安全論壇的主持討論中,基辛格表示:“目前,中國占半導體出口的 25% 至 30%。 如果我的市場減少 25% 或 30%,我就需要建造更少的工廠。 我們相信,我們希望最大限度地向世界出口……您不能放棄 25% 到 30% 的市場以及世界上增長最快的市場,並期望繼續為我們發布的研發和製造周期提供資金。 我們想要最大化。 目前,半導體是對中國的第二大出口產品,僅次於大豆這一戰略類別,甚至沒有緊隨其後的第三位。 這對我們的未來具有戰略意義。 我們必須繼續為研發、製造等提供資金……”
為了抓住中國機遇並同時管理風險,跨國公司有多種選擇來組織其供應鏈,例如采取“在中國,為中國”的方式,即在中國為國內市場生產零部件。 跨國公司還可以采取“中國加一”戰略,在國外建立一條額外的區域供應鏈以到達中國及周邊市場,或者維持一條以中國為組成部分的全球供應鏈。
擴大而不是減少貿易聯係
全球供應鏈多元化不一定是零和遊戲。
隨著勞動密集型供應鏈從中國轉移,越南、印度、柬埔寨和墨西哥等國家可能會擴大其在全球製造業中的份額。 在岸和友岸外包趨勢也可能使西方的一些行業受益。
但對中國上遊材料和商品的依賴意味著該國仍可能發展其製造業並向供應鏈上遊移動。
中國繼續與全球各國進行貿易,並尋求擴大貿易關係。 中國正在經曆的不是“去全球化”,而是貿易流向的轉變,將重點轉向加強“一帶一路”倡議以及與俄羅斯、中東、中亞、東盟等國家和地區的合作。 這一轉變旨在減少中國對西方的依賴,擴大與更廣泛的國家或全球 80% 人口的貿易關係。
話雖如此,並非所有供應鏈轉移都一定具有成本效益。 在某些情況下,出於國家安全考慮,各國可能會建設冗餘的製造能力,從而可能導致最終產品價格上漲。
例如,根據半導體研究和谘詢公司 SemiAnalysis 的數據,台積電 (TSMC) 美國工廠生產的芯片可能比台灣和中國大陸生產的芯片貴 15% 至 20%。
是進化,而不是崩潰
去全球化是一個複雜的話題,最近已成為一個帶有地緣政治色彩的術語。 然而,從表麵上看,我們發現從 20 世紀 80 年代到 2008 年的激烈全球化時期向更加碎片化時期的轉變是國際貿易和商業的自然演變。 用“供應鏈轉型”代替“去全球化”的想法或許會更加清晰。
從概念上講,它類似於在國家安全和主權發展優先的時期,供需的市場力量優化資源配置,找到自然平衡。 這種演變可能取決於成本、製造複雜性以及法律和政治框架等因素。
縱觀現代曆史,許多經濟體都成功地實現了供應鏈轉型,包括英國、美國、日本和“亞洲四小龍”(韓國、台灣、香港和新加坡)。 我們相信中國的經驗不會有什麽不同。
研究資源
所需披露
本文中的材料僅供參考,並不針對任何國家/地區的任何個人或實體,也不旨在向任何國家/地區的任何個人或實體分發或使用,如果此類分發或使用將違反法律或法規或將受到加拿大皇家銀行的約束 或其子公司或組成業務單位(包括加拿大皇家銀行財富管理公司)遵守該國家/地區的任何許可或注冊要求。
這並非任何加拿大皇家銀行實體出售或提供任何特定金融賬戶、產品或服務的具體要約,也不是申請任何特定金融賬戶、產品或服務的具體邀請。 加拿大皇家銀行不會在不允許的司法管轄區提供賬戶、產品或服務,因此加拿大皇家銀行財富管理業務並非在所有國家或市場都可用。
本文包含的信息本質上是一般性的,無意且不應被解釋為向用戶提供的專業建議或意見,也不得解釋為任何特定方法的推薦。 本材料中的任何內容均不構成法律、會計或稅務建議,建議您在按照本材料中包含的任何內容采取行動之前尋求獨立的法律、稅務和會計建議。 利率、市場狀況、稅收和法律規則以及與您的情況相關的其他重要因素可能會發生變化。 本材料並不旨在成為可能適合用戶的方法或步驟的完整陳述,未考慮用戶的具體投資目標或風險承受能力,也無意邀請進行證券交易或 以其他方式參與任何投資服務。
在法律允許的最大範圍內,加拿大皇家銀行財富管理公司及其任何附屬公司或任何其他人均不對因使用本文件或其中所含信息而產生的任何直接或間接損失承擔任何責任。 未經 RBC Wealth Management 事先同意,不得以任何方式複製或複製本材料中包含的任何內容。 RBC財富管理是描述加拿大皇家銀行及其附屬機構和分行財富管理業務的全球品牌名稱,包括加拿大皇家銀行投資服務(亞洲)有限公司、加拿大皇家銀行香港分行和皇家銀行 加拿大、新加坡分公司。 可根據要求提供更多信息。
加拿大皇家銀行根據《銀行法》(加拿大)正式成立,為股東提供有限責任。
® 加拿大皇家銀行的注冊商標。 經許可使用。 RBC 財富管理是加拿大皇家銀行的注冊商標。 經許可使用。 版權所有 © 加拿大皇家銀行 2023。保留所有權利。
xxxx
China's next act in a changing economic order
https://www.rbcwealthmanagement.com/en-asia/insights/chinas-next-act-in-a-changing-economic-order
As nations move away from the post-Cold War period of intense globalization, how will the world’s manufacturing powerhouse adapt to the new economic paradigm?
By Jasmine Duan, August 14, 2023
RBC Wealth Management's “Worlds apart: Risks and opportunities as deglobalization looms” series explores the trend away from globalization and its ramifications for investors, economies, and financial markets. The latest feature in the series focuses on China’s unique role in global supply chains and manufacturing.
- A Western decoupling from China is unrealistic as supply chains are highly complex and interconnected. China is gaining market share in global manufacturing by moving up the supply chain.
- China has demonstrated an ability to overcome the impact of technological restrictions in the past. The country’s vast manufacturing scale and well-established supply chains should lay a foundation for future technological innovation.
- The country began shifting away from low-end, labour-intensive component manufacturing to higher-tech, full-spectrum product manufacturing more than a decade ago.
- China’s domestic market is too big to be ignored by multinational corporations. But we think multinationals need to determine how to pursue opportunities in China while at the same time effectively managing risks.
- The supply chain transformation we are witnessing is a natural evolution of international trade and commerce. We believe China can successfully navigate this period just as many other countries have in modern history.
News headlines often highlight the role of geopolitics and the COVID-19 pandemic in driving Western-based multinational companies to relocate their supply chains away from China. This, in turn, fuels a narrative that emphasizes these factors as the primary catalysts for change in global supply chains and China’s manufacturing sector.
As trade flows shift away from the intense period of globalization to something more fragmented, geopolitical factors are indeed playing a role. Governments are promoting and incentivizing the onshoring and friend-shoring of manufacturing, and many multinational companies are looking to diversify their supply chains.
However, for China, we think the situation is more complex and less pessimistic than mainstream headlines portray.
First, the high complexity of global supply chains, combined with the extensive scale of China’s industrial sector and manufacturing competencies, makes it undesirable and unrealistic for many multinational companies to make a complete break with China anytime soon, in our view.
Second, for years China’s manufacturing sector and global supply chains have evolved in response to forces that are unrelated to the current trade and political frictions between the U.S. and China.
Even if onshoring and friend-shoring trends pick up pace in developed countries, we think the mutually beneficial relationships that China has forged with numerous multinational companies over more than four decades will keep China integrated within the global economic and investment landscapes.
Supply chains are far more interconnected and complex than imaginable
Companies producing complex products often have four or more layers of thousands of suppliers.
According to consulting firm McKinsey & Co., technology companies have 125 tier-one suppliers (i.e., the direct suppliers of the final product or the fully built components used to create the final product) and more than 7,000 across all tiers, on average.
An auto manufacturer typically has around 250 tier-one suppliers, but the number increases to 18,000 across the full supply chain.
The complexity of global supply chains frequently results in interdependencies between companies in countries with upstream products or materials.
For example, as the 10 ASEAN* countries of Southeast Asia have built out their manufacturing competencies, they have become more connected with China’s manufacturing supply chain. ASEAN members imported US$177 billion of goods from China in 2012. In just 10 years, this more than doubled to US$388 billion by 2021.
China’s imports to ASEAN have more than doubled in the past decade
U.S. dollars (billions)
Line chart showing ASEAN countries’ import value from China for the period of 2012 through 2021. The chart shows imports steadily rising over the years and more than doubling from US$177 billion in 2012 to US$388 billion in 2021.
*The Association of Southeast Asian Nations (ASEAN) is a regional intergovernmental organization comprising 10 member states: Indonesia, Malaysia, the Philippines, Singapore, Thailand, Brunei, Cambodia, Laos, Myanmar, and Vietnam.
Source – Statista, RBC Wealth Management; yearly data through 2021
The ASEAN region remains highly dependent on China’s inputs and capital goods, which are essential to products manufactured in those countries. If multinational companies want to produce more goods in the region in the coming years, we think Chinese production will also play a meaningful role in the supply chain.
China’s vast manufacturing footprint
The “Made in China” label is familiar to many people, yet the full scale and scope of Chinese manufacturing may still be underestimated.
Chinese manufacturing has ranked first in the world in terms of scale for over a decade. In 2021, China accounted for 30 percent of global manufacturing output, according to the UN. By comparison, the EU in aggregate accounted for 16 percent, the U.S. 15 percent, and Japan and Germany accounted for six percent and five percent, respectively.
Currently, China is the only country in the world that conforms to the standards of all manufacturing-related sections of the UN’s statistical reference classification system. This illustrates the wide breadth of China’s production capacity. Designations for many of its industries rank first in the world.
China’s rise as an intellectual property leader also contributes to the sophistication and development of its manufacturing base.
In 2019, China overtook the U.S. to become the largest source of international patents filed under the World Intellectual Property Organization’s (WIPO) Patent Cooperation Treaty.
China filed the most Patent Cooperation Treaty applications in 2022
Bar chart showing the top 10 countries filing the most patent applications under the World Intellectual Property Organization’s Patent Cooperation Treaty (PCT). Applicants from China filed 70,015 PCT applications followed by the U.S. (59, 056), Japan (50,345), the Republic of Korea (22,012), Germany (17,530), France (7,764), the UK (5,739), Switzerland (5,367), Sweden (4,471), and the Netherlands (4,092).
Source – World Intellectual Property Organization statistics database (February 2023), RBC Wealth Management
As China migrates from being a low-cost manufacturing hub to one that increasingly focuses on innovation and complex manufacturing techniques, we think the country will maintain its manufacturing dominance while at the same time make inroads into emerging and strategic fields such as electric vehicles (EV), telecommunications, bioengineering, artificial intelligence (AI), and other areas.
Manufacturing competencies have become more technologically advanced
China has established comprehensive supply chains across various industries over the past few decades, largely thanks to the localization process of multinationals and strategic joint ventures. These collaborations have enabled China to acquire technologies and know-how, and have laid the foundation for its own technological innovation.
In recent years, the West has started implementing restrictions on China’s access to critical technologies, such as AI, quantum computing, and advanced semiconductors, raising concerns about the country’s ability to move further up the supply chain and achieve its stated “technological self-reliance” goals.
This could pose challenges to China’s technology development and potentially slow it down. However, it’s important to remember that China has demonstrated an ability to overcome the impact of technological restrictions in the past. Two examples include the Tiangong space station and China’s development of EVs.
Tiangong: From the sidelines to an independent space power
The International Space Station (ISS) is a co-operative program between the U.S., Europe, Russia, Canada, and Japan. It has welcomed astronauts from 21 different countries as of June 2023.
In 2011, the U.S. Congress passed a law which was signed by the president prohibiting the country’s National Aeronautics and Space Administration (NASA) from funding or engaging in direct, bilateral cooperation with China, thus effectively preventing China from joining the ISS.
In response, China spent the next decade developing and launching individual modules to complete its own permanent space station called Tiangong, or “Heavenly Palace,” in 2023.
Tiangong established China’s independent presence in space. It enables the country to conduct advanced scientific research and represents a significant, game-changing step for China as a global space power. With the ISS scheduled to be retired in 2031, Tiangong would then be the only space station in operation.
Auto industry: From nascent to high tech
A comprehensive supply chain developed over the past few decades paved the way for China’s technological advancement in the automotive industry.
The general rule of thumb is, the larger the production scale in a particular manufacturing segment, the easier it is to improve production efficiency, product quality, and technology.
China has sought to overcome technology hurdles by putting in place national policies and capital support, nurturing domestic talent, and forming strategic, mutually beneficial alliances with other nations.
China’s development of its automotive industry, particularly its rapid progress in EV technology, provides insights into the country’s ability to scale up production into higher-tech manufacturing.
The auto sector in China saw rapid growth after the government’s Reform and Opening-up period in the late 1970s and 1980s. The industry formed joint ventures with foreign automakers such as Volkswagen, General Motors, and Honda.
At first, China’s auto industry relied heavily on foreign technologies, particularly when it came to engines and transmission designs – core components of internal combustion vehicles.
Over time, China developed extensive auto supply chains and manufacturing capacity, while actively encouraging the development of skilled engineering talent.
By the early 2000s, China started to explore alternative energy vehicles. In the 2010s, the government introduced a series of policies designed to support research and development (R&D) and encourage EV adoption.
Many of the technologies and production techniques used in traditional vehicle production can be transferred to EV manufacturing. At the same time, the core components and technologies of an EV include the battery, electric motor, and electronic control system, which vary greatly from the components that make up a traditional vehicle with an internal combustion engine.
With robust manufacturing know-how and supportive public incentives, China’s automotive industry was able to free itself from the technological constraints of traditional fossil fuel drivetrains and make inroads into more advanced, cleaner technologies.
A recent report from Patent Result highlights China’s lead in EV charging patents. From 2010 to 2022, Chinese companies submitted 41,011 patent applications in this field, which is 52 percent higher than that of Japan and nearly three times the number of U.S. EV charging patents. China has now become the largest exporter of new EVs, overtaking Japan, the U.S., and Europe.
China’s shift away from labour-intensive manufacturing
Other factors that have little to do with the current geopolitical frictions between the U.S. and China have also helped to transform Chinese supply chains and manufacturing processes. These mostly stem from China’s own economic development.
Over the past 20 years as China’s economy has grown markedly, labour costs have more than doubled, forcing labour-intensive industries such as footwear and apparel manufacturing to relocate to countries with more affordable labour – in many cases to ASEAN countries.
This process can be traced back to when China began upgrading its manufacturing sector more than a decade ago.
Some labour-intensive industries began to move away from coastal manufacturing hubs into less developed inland cities and provinces.
Later, as labour costs increased there as well, production began migrating abroad with Chinese-owned factories popping up in ASEAN countries. The range of Chinese manufacturing investments in the region includes textiles, consumer electronics, EV supply chains, pharmaceuticals, and others.
As of 2021, China has become the third-largest international source of foreign direct investment in the ASEAN region at US$14 billion, following the U.S.’s US$40 billion and the US$21 billion that ASEAN countries invest in each other.
Supply chain diversification: Less than what is advertised
Although there has been some degree of supply chain diversification away from China, this change is not as significant as one might assume. A good example comes from the electronics and machinery sector, which is the largest goods category in global trade.
The sector is dominated by China in exports but has been shifting somewhat to ASEAN countries in recent years. China’s electronic exports by value to the U.S. decreased by 10 percentage points from 2018 to 2021. Most of the slack was taken up by ASEAN countries, according to a study by Macro Polo, a U.S.-based think tank connected to the Paulson Institute (founded by former U.S. Treasury Secretary Hank Paulson).
One may easily draw the conclusion that China has been losing ground to ASEAN countries in global manufacturing. However, the data tell a different story. ASEAN countries’ gains in global manufacturing are comparatively minor; the region’s market share climbed slightly from around three percent in 2010 to about five percent by 2021, while China’s share rose from 20 percent to 30 percent over the same period.
The data indicate to us that while some of the final assembly of manufactured products may have shifted from China to ASEAN, China’s overall manufacturing capacity has remained elevated.
China has been gradually replacing labour-intensive industries with more advanced and higher value-added manufacturing. Prime examples of this structural transformation are the export boom of three renewable energy products: new energy vehicles, solar cells, and lithium batteries.
As China moves up the supply chain, its economy is becoming more complex
Harvard Economic Complexity Index rankings; “1” is the most complex
Line chart showing various countries’ (Japan, the U.S., China, Mexico, India, and Vietnam) complexity rankings from 1995 to 2020. Japan has been ranking first in the index since 1995. China’s ranking improved to 18th in 2020 from 46th in 1995. The U.S.’s ranking has trended slightly down over the years and ranked 14th in 2020, while Mexico was 29th in 1995 and rose to 20th in 2020. India’s and Vietnam’s rankings increased from 60th to 46th and from 107th to 57th, respectively.
- Japan
- U.S.
- China
- Mexico
- India
- Vietnam
Note: Economic development requires the accumulation of productive knowledge and its use in a wider range of more complex industries. The Harvard Growth Lab’s Economic Complexity Index (ECI) assesses the state of a country’s productive knowledge. As the number and complexity of a country’s exports increase, the country’s ECI moves toward “1”; for example, in this data, Japan has consistently had the highest ECI of 1, whereas Vietnam currently has the lowest at 57, although its score has been improving.
Source – Harvard Growth Lab, RBC Wealth Management
Simultaneously, China has shifted its trade model away from processing trade, which relies on supplied materials or components. Processing trade has historically been used by manufacturers seeking access to specialized inputs or lower labour costs. Its share in China’s total exports has decreased to around 20 percent, down from 55 percent in 2000. At the same time, finished goods export unit values have continued to rise, signaling an ongoing industrial upgrade.
As Chinese manufacturing has become more complex, the value of vehicle exports has surged
U.S. dollars (millions)
Line chart showing China’s monthly export value of mobile phones and vehicles from May 2020 through May 2023. In May 2020 vehicle exports totaled US$1,305 million and they have been increasing (last reading was US$7,758 million). Vehicle export value has now caught up with that of mobile phones (last reading was US$8,101 million), traditionally an important export segment.
- Mobile phones
- Vehicles
Source – RBC Wealth Management, Bloomberg; monthly data through June 2023
Will China remain an attractive investment destination?
China and multinational corporations built mutually beneficial relationships after the country’s Reform and Opening-up period in the 1970s and 1980s. China acquired technology and management know-how from multinationals, while these companies enjoyed low production costs in China and higher profits (which we think boosted stock prices), as well as access to China’s large domestic market.
However, more recently, multinationals have begun reassessing the business environment and their investment plans in China.
In a survey conducted by the American Chamber of Commerce in China, the share of multinational corporations perceiving China as one of their top three investment priorities dropped from 78 percent in 2012 to 45 percent in 2022.
Uncertainty around China’s policy environment, multinationals’ expectation of slower economic growth, and overall uncertainty about the U.S.-China economic and political relationship were the top concerns of survey respondents. Other concerns stem from China’s aging demographics and the country’s restricted access to key technologies. Rising competition from Chinese domestic players also poses challenges to multinationals.
Despite these concerns, in our view, China still presents opportunities that cannot be ignored.
With its GDP accounting for 18 percent of the global total, we think the size of China’s economy alone demands attention from multinationals. The country has the world’s largest middle-income class. Based on McKinsey’s estimates, more than 40 percent to 50 percent of China’s population will live in high-income cities by 2030.
In sectors such as automobiles, luxury goods, and industrial equipment, China’s market contributes 25 percent to 40 percent of global revenues. In our view, this makes it hard for multinational corporations to choose to not compete in the Chinese market.
Intel’s CEO Pat Gelsinger has acknowledged that maintaining access to China’s semiconductor market is very important due to the revenue opportunities and because that revenue helps fund Intel’s R&D and internal expansion.
During a moderated discussion at the Aspen Security Forum in July, Gelsinger said: “Right now, China represents 25 to 30 percent of semiconductor exports. If I have 25 or 30 percent less market, I need to build less factories. We believe we want to maximize our exports to the world … You can’t walk away from 25 to 30 percent and the fastest growing market in the world and expect that you remain funding the R&D and the manufacturing cycle that we’ve released. We want to maximize. And right now semiconductors are the number two export to China behind that strategic category of soybeans, and there’s not even a close number three. This is strategic to our future. We have to keep funding the R&D, the manufacturing, et cetera …”
To capture opportunities in China and manage risks at the same time, multinationals have various options to organize their supply chains, such as adopting an “in China, for China” approach, where components are manufactured in China for its domestic market. Multinationals could also adopt a “China plus one” strategy, by establishing an extra regional supply chain outside of the country to reach China and surrounding markets, or by maintaining a global supply chain utilizing China as one component.
Expanding, not reducing, trade ties
Global supply chain diversification doesn’t have to be a zero-sum game.
With labour-intensive supply chains shifting away from China, countries such as Vietnam, India, Cambodia, and Mexico could expand their shares of global manufacturing. The onshoring and friend-shoring trends are also likely to benefit some industries in the West.
But the dependency on China’s upstream materials and goods means the country can likely still grow its manufacturing sector and move up the supply chain.
China continues to trade with countries globally and seeks to expand trade ties. Rather than “deglobalizing,” China is experiencing a shift in trade flows, adjusting its focus towards strengthening its Belt and Road Initiative and cooperation with countries and regions including Russia, the Middle East, Central Asia, and ASEAN. This shift aims to reduce China’s reliance on the West and expand trade ties with a broader range of countries, or the 80 percent of the rest of the global population.
Having said that, not all supply chain shifts will necessarily prove cost-effective. In some cases, countries might construct redundant manufacturing capacities driven by national security concerns, potentially resulting in increased end-product prices.
For example, chips made in Taiwan Semiconductor Manufacturing Company’s (TSMC) U.S. factory are likely to be 15 percent to 20 percent more expensive than those made in Taiwan and China, according to semiconductor research and consulting firm SemiAnalysis.
An evolution, not a breakdown
Deglobalization is a complicated topic, and recently has become a geopolitically loaded term. However, beneath the surface, one finds that the shift away from the period of intense globalization that occurred from the 1980s through 2008 to something more fragmented is a natural evolution of international trade and commerce. Substituting the idea of “supply chain transformation” for “deglobalization” perhaps provides more clarity.
Conceptually, it is akin to the market forces of supply and demand optimizing the allocation of resources to find a natural equilibrium in a period in which national security and sovereign development are being prioritized. The evolution could depend on costs, manufacturing complexity, as well as legal and political frameworks, among other factors.
Throughout modern history, many economies have successfully navigated supply chain transformation including Great Britain, the U.S., Japan, and the “Four Asian Tigers” (South Korea, Taiwan, Hong Kong, and Singapore). We do not believe the China experience will prove to be any different.
The material herein is for informational purposes only and is not directed at, nor intended for distribution to or use by, any person or entity in any country where such distribution or use would be contrary to law or regulation or which would subject Royal Bank of Canada or its subsidiaries or constituent business units (including RBC Wealth Management) to any licensing or registration requirement within such country.
This is not intended to be either a specific offer by any Royal Bank of Canada entity to sell or provide, or a specific invitation to apply for, any particular financial account, product or service. Royal Bank of Canada does not offer accounts, products or services in jurisdictions where it is not permitted to do so, and therefore the RBC Wealth Management business is not available in all countries or markets.
The information contained herein is general in nature and is not intended, and should not be construed, as professional advice or opinion provided to the user, nor as a recommendation of any particular approach. Nothing in this material constitutes legal, accounting or tax advice and you are advised to seek independent legal, tax and accounting advice prior to acting upon anything contained in this material. Interest rates, market conditions, tax and legal rules and other important factors which will be pertinent to your circumstances are subject to change. This material does not purport to be a complete statement of the approaches or steps that may be appropriate for the user, does not take into account the user’s specific investment objectives or risk tolerance and is not intended to be an invitation to effect a securities transaction or to otherwise participate in any investment service.
To the full extent permitted by law neither RBC Wealth Management nor any of its affiliates, nor any other person, accepts any liability whatsoever for any direct or consequential loss arising from any use of this document or the information contained herein. No matter contained in this material may be reproduced or copied by any means without the prior consent of RBC Wealth Management. RBC Wealth Management is the global brand name to describe the wealth management business of the Royal Bank of Canada and its affiliates and branches, including, RBC Investment Services (Asia) Limited, Royal Bank of Canada, Hong Kong Branch, and the Royal Bank of Canada, Singapore Branch. Additional information available upon request.
Royal Bank of Canada is duly established under the Bank Act (Canada), which provides limited liability for shareholders.
® Registered trademark of Royal Bank of Canada. Used under license. RBC Wealth Management is a registered trademark of Royal Bank of Canada. Used under license. Copyright © Royal Bank of Canada 2023. All rights reserved.
