風蕭蕭_Frank
以文會友


The Canada-China Global Commerce Picture and Supply Chain Links
By Colin Scarffe
Colin David Scarfe
University of Victoria
Department Physics-Astronomy
PO Box 3055 STN CSC
Victoria BC V8W 3P6
British Columbia (BC), Canada
Phone: +1 250 721 7749
Fax: +1 250 721 7715
NCA adherence: Canada
 Economist in the Office of the Chief Economist at Global Affairs Canada
Faculty of Social Sciences
Business & Economics Bldg, room 456
University of Victoria
soscassist@uvic.ca
Position
Economics - BSc (2016)
Colin currently serves as an economist in the Office of the Chief Economist at Global Affairs Canada. In this role, he is able to apply the economic theory from his degrees to his daily job. Global Affairs Canada works to shape and advance Canada’s interest in the global community. Colin now has several long running research projects regarding the environment, trade, and the supply chain. Colin’s economic research is used by policy and decision makers in the Federal Government.
In middle school, Colin read Freakonomics and found this intro to economics very interesting. Given his interests in finance and statistics, economics was a great fit! Colin went through the BSc program at UVic and found it prepared him well for both the work force and graduate studies at the University of British Columbia.
After completing his undergraduate degree, Colin worked as a research assistant at the Bank of Canada for one year. This work experience helped him not only solidify what he had learned but help show him what areas he was interested in for when he went to complete his Masters.
When Colin is not busy working on economic research, he enjoys playing Ultimate Frisbee. He first found this sport while studying at UVic. Colin is now the captain of his competitive team in Ottawa. He finds the concepts from economic finance useful when considering high risk plays in Frisbee. Over the long-term (a game or a tournament), taking higher risk plays will lead to a higher outcome, but in the short-term (a single point to win the game) it's better to take the low-risk, low-reward plays and be prudent getting the disk down the field.
When reflecting on his time as a student, Colin’s advice for current students is:
The most important aspect of undergrad and grad school was showing up to class, doing the homework, and doing the readings. The best way I learn is by struggling through a problem set and trying to explain to someone else how to do the problem. I think the readings are an important part that are often ignored by students. The textbooks will phrase things slightly differently than the professors, and hearing (or reading) things in a slightly different way may make different things click in your mind.
Global Affairs Canada
https://www.international.gc.ca/global-affairs-affaires-mondiales/home-accueil.aspx?lang=eng
We define, shape and advance Canada’s interests and values in a complex global environment. We manage diplomatic relations, promote international trade and provide consular assistance. We lead international development, humanitarian, and peace and security assistance efforts. We also contribute to national security and the development of international law.
The Canada-China Global Commerce Picture and Supply Chain Links
1. Summary
- China is Canada’s second most important bilateral commercial partner (or third with the EU-27 is counted as a whole). Canada’s imports from and exports to China are diverse by product, and the complexity of the traded products are at approximately the same level.
- Investment and the activity of multinational enterprises has been increasing rapidly between the two countries; however, the overall levels remain low compared with Canada’s investment relationships with other countries.
- The welfare of Canadians is enhanced by importing consumer goods from China. The imports of intermediate and capital goods, particularly electrical equipment, are important inputs to Canadian production.
Introduction
There have been many studies that examine the Canada-U.S. trade relationship; this is deservedly so as the U.S. is Canada’s dominant trading partner. In 2018, the minister of international trade diversification announced a target to increase overseas exports by 50% by 2025.1 China is the world’s second largest economy and is the second most important bilateral commercial partner for Canada. Thus, China might be a key market if Canada is to achieve its export diversification target. The goal of this paper is to explore Canada’s commercial relationship with China. This will be done by examining trading and investment relationship between the two countries over the last two decades. Additionally, COVID-19 showed the world that in extreme cases, production within a country can be brought to a halt. Therefore, the second part of this paper will examine how a disruption to trade with China might affect Canadian supply chains and production.
Trade and Investment
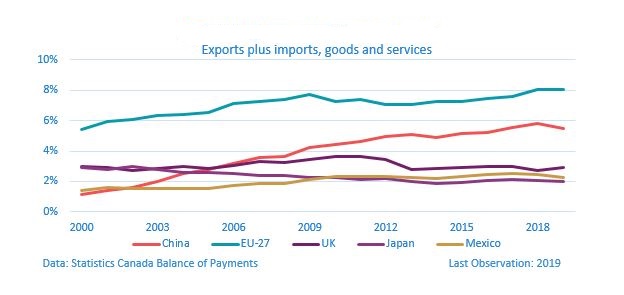
Since its ascension into the World Trade Organization (WTO) in 2001, Canada’s trade with China has grown faster than Canada’s trade with any other principal trading partner. Despite a downturn in goods exports in 2019, bilateral goods trade has grown at a rate of 11% per-year, and services trade has grown at a rate of 12% per-year.2,3 It follows that China’s share of Canada’s trade has risen dramatically in the last 20 years, from about 1% in 2000 to nearly 6% in 2019. While the magnitude of Canada’s trade with China pales in comparison with Canada’s trade with the United States, China is Canada’s second largest trading partner (or third when trade with the EU-27 as a whole is included).4
Figure 1: Shares of Canada's trade
Canada’s merchandise exports to China are diverse, with no product having a share of exports greater than 17% at the HS-1 level (21 products). Using the HHI5 to measure the concentration of exports by HS-2 products (96 products), in 2019 Canada’s exports to China were more diverse than Canada’s exports to any other of its top 10 trading partners. In fact, since 2000 Canada’s exports to China have been the most diverse of Canada’s 2019 top 10 trading partners in 12 of the 20 years.6 Using the broad economic categories (BEC), 73% of Canada’s exports to China are classified as intermediate goods, which appears to be consistent with the fact that many of Canada’s exports to China are primary products such as minerals and wood pulp.
Figure 2: Trade by broad economic categories

The import side has a somewhat different narrative. Since the year 2000, Canadian imports from China have been becoming more concentrated. At the HS-1 level, machinery and electrical equipment account for 45% of imports. At the HS-2 level, while imports from China are still considered diverse by the HHI, they are the fifth most concentrated basked of imports compared with Canada’s top 10 trading partners.7 However, compared with exports, Canada’s imports from China are more balanced by BEC classification.
One explanation for the high share of machinery and electrical equipment imports, as well as the higher shares of capital and consumer goods, is that China, at least historically, is the final assembly point for many supply chains across Asia. However, this is changing. For the latter part of the 20th century and the early parts of the 21st century, China was an ideal assembly point for supply chains due to a substantial supply of inexpensive labour, good infrastructure, and lax regulations.8,9 Yet, between 1980 and 2017, China’s economy grew at an average of 9.6% per-year, while its population grew at a rate of only 0.9% per-year.10 This led to a GDP-per-capita growth rate of 8.6% per-year, meaning GDP-per-capita in China has doubled every 8.4 years since 1980. While there has been significant capital deepening in China, according to the World Inequality Database, real wages have grown at a comparable rate of 7.9% per-year over the same period.11 Further, although wages in the bottom decile haven’t grown quite as fast, they still tripled between 1980 and 2015.12 All of these statistics point to rising labour costs and more importantly, suggest a higher reservation wage for workers.13 Additionally, the Chinese Communist Party (CCP) has started to tighten regulations, particularly environmental protections, meaning firms have to meet increasing standards to operate in China.14 These factors together have resulted in some firms moving low value-added activities to other countries and away from China.15
The phenomenon of China becoming the hub of a regional supply chain network (and not always the place of final assembly) is changing the nature of Canada’s trade with China. In 2000, 57% of Canada’s imports from China were in consumption goods—consistent with the narrative of China being the final assembly point for Asian supply chains—16% of imports were capital goods, and 27% were intermediate goods. By 2019, only 41% of imports from China were in consumption goods, 26% were in capital goods, and 32% were in intermediate goods—all consistent with China playing a different role on the production process.
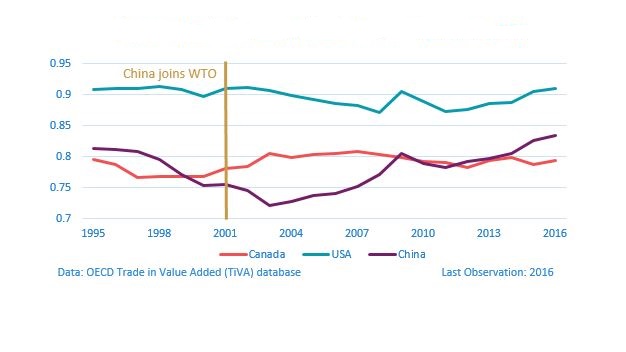
A second piece of evidence is that in 1995, the ratio of value-added exports to gross exports in China was approximately 81%.16,17 However, in part as a result of China joining the WTO and becoming apart of global value chains, this ratio decreased to approximately 72% in 2003. This means that 28% of the value in Chinese exports had been imported from other countries and is consistent with the narrative that China did many low-value added processes in the supply chain. By 2016, however, China’s exports in value added terms were 83% of its gross exports. 18 Again, this is supportive of China no longer being just the final assembly point, but is doing more of the higher value added activities in the production process. This is consistent with Chor et al. (2020) who find that Chinese firms are spanning a wider segment of the production process in supply chains.19 They found that Chinese exports in 2014 were slightly less downstream (i.e. further away from being a final good) than in 1992, whereas imports are much more upstream (i.e. closer to raw materials). These facts taken together mean that China is doing more of the production process in country.
Figure 3: Ratio of value-added exports to gross exports
Using the framework from Hausmann et al. (2007), it is also possible to determine the complexity of the traded goods.20 Instead of measuring the technical elements in each good, a weighted-average of GDP-per-capita from all countries’ exports is used to classify the complexity, or the income level, of each HS-6 product.21 Using UN Comtrade data, in 2000 the average country income level for exports was $8300. Both China’s and Canada’s exports were above average: China’s complexity was about $10,300 while Canada’s was about $14,100 (a little less than one standard deviation higher). By 2009, the complexity of Chinese exports surpassed the complexity of Canadian exports. However, since then the complexity of the exports of the two countries have moved in lockstep.22
This raises the question of whether this is Chinese exports catching up, or Canadian exports falling behind. Combining a group of 10 major economies together to create a reference basket, the answer is a little of both—but not in the expected way. From 2000-2008, Chinese caught up significantly with Canadian exports, and Canadian exports were only slightly lower than the reference group. However, after 2008, both Chinese exports and Canadian exports fell behind the reference group.
Figure 4: Bilateral export complexity (income level of exports)
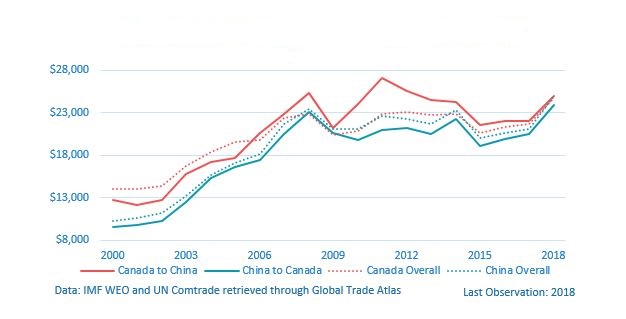
Examining the complexity of the two-way trade between the two countries reveals that the goods being traded are more or less at the same income level. Canada’s exports to China have always been at a higher level than China’s exports to Canada; however, apart from the 2010-2013 period, the difference between the two series is minimal. Additionally, the difference between each countries overall export basket and these particular export baskets is small; in 2018, Canada’s exports to all countries, Canada’s exports to China, China’s exports to all countries, and China’s exports to Canada were all at approximately the same level of complexity.
In addition to changing the composition of trade, China’s rapidly increasing wealth is fostering closer commercial connections on this side of the Pacific. One example is the increasing demand of Chinese international post-secondary students; international students often pay higher tuition fees at Canadian post-secondary institutions and are thus an important source of funding. In 1992, there were just 2,900 Chinese international students at Canadian post-secondary institutions; by 2018, there were 81,500 Chinese students, representing 27% of all international students. Likewise in 1990, Chinese tourists only spent $95 million in Canada, representing a little over 1% of all tourist spending. In 2018, Chinese tourists spent $5.9 billion in Canada, or over 17% of all tourist spending.23
Figure 5: International student enrollment at post-secondary institutions

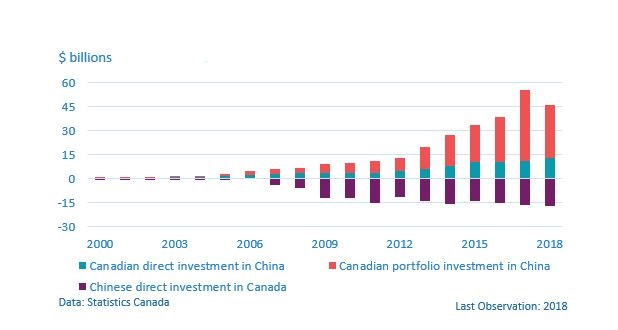
Following the pattern established by all other variables, two-way investment with China has grown exponentially in the last twenty years. In 2000, China’s stock of direct investment in Canada (FDI) was $190 million. By 2018, China’s FDI stock in Canada had grown to $17 billion. Likewise, in 2000 Canada’s stock of direct investment in China (CDIA) was $560 million. By 2018, this had grown to $12.7 billion. While these numbers have grown substantially, Canada’s CDIA in China represents less than 1% of outward CDIA stock in 2018, and China’s investment in Canada represents less than 2% of inward FDI stock. Additionally, Canada’s portfolio investment in China has increased significantly, and the stock was at $34 billion in 2018 (almost 3 times the amount of Canada’s CDIA in China).24 However, similar to direct investment, Canada’s stock of outward portfolio investment to the world was $2.2 trillion in 2018, so the share directed towards China is less than 2%. Part of the explanation for these relatively low shares and fast growth is that China did not allow investment to move across its border until recently, and is still in the process of liberalizing its capital account.25
Figure 6: Canadian Investment positions
This expansion in two-way investment has allowed Canadian and Chinese firms to set up operations close to market and sell goods and services directly. Canadian multinationals operating in China had sales of $12.7 billion in 2017, and held $22.5 billion worth of assets. While these numbers are considerable, they pale in comparison with Canada’s $685 billion in multinational sales globally and over $4 trillion in total assets held in the same year. Chinese multinationals did $14.8 billion of sales in Canada during 2017, and employed close to 23,000 Canadians. While these numbers are not huge, similar to the rest of the Chinese economy, they have been growing fast. In 2011, Chinese multinationals employed just 1,800 Canadians. Additionally, Chinese multinationals added $3.2 billion to Canadian GDP in 2017, up from just $110 million in 2011.26 Similar to investment, part of the explanation for the relatively low level has to do with capital account restrictions. As such, as liberalization continues it is likely that these numbers will continue their fast growth.
Supply Chains and potential vulnerabilities
Limited Supply Products
China is the dominant supplier for many goods traded globally—China is the dominant supplier in the world for every 1 in 12 traded products at the HS-6 level.27 Many of which are electrical products, inorganic chemicals, and textiles.28 The HS-6 level has 5,428 products; in 2018, China exported 5000 products, and had a share greater than 50% in 448 products.29 There is nothing special about the 50% threshold; China has 10% of the market share in 2,615 products—about half of all products—and that in itself would not be easily replaceable. However, what is particularly striking is that China makes up over half of the world supply for 1 in every 12 products. For comparison, the USA has a 10% supply share in 1,492 products, and a 50% supply share in 101 products.
| Market Share | China | USA | Germany | India | Mexico | Netherlands | Canada |
|---|---|---|---|---|---|---|---|
| 0% | 5000 | 5323 | 5121 | 5033 | 4615 | 5213 | 4988 |
| 10% | 2615 | 1492 | 1594 | 411 | 200 | 562 | 195 |
| 20% | 1698 | 545 | 585 | 177 | 84 | 194 | 85 |
| 30% | 1153 | 279 | 207 | 99 | 48 | 85 | 56 |
| 40% | 749 | 157 | 74 | 60 | 34 | 44 | 39 |
| 50% | 448 | 101 | 40 | 38 | 27 | 24 | 22 |
| 60% | 263 | 54 | 15 | 25 | 24 | 14 | 16 |
| 70% | 141 | 31 | 10 | 7 | 21 | 11 | 10 |
| 80% | 50 | 19 | 7 | 6 | 15 | 6 | 7 |
| 90% | 6 | 7 | 1 | 1 | 10 | 0 | 1 |
Data: UN Comtrade retrieved through Global Trade Atlas
The number of products that China exports that exceeds the 10% threshold and the 50% threshold have grown tremendously since China joined the WTO in 2001. However, despite 2018 being the year with the most products surpassing both thresholds, the growth in the number of products has been slowing. 2016 was the first year that either category decreased, and they both decreased. There has been a recovery in 2017 and 2018, but the level remains below the trend. It remains to be seen where these categories are heading: it could be that growth in these categories continues in 2019, the curve could flatten, or it could take a parabolic shape and begin to decrease.
Figure 7: Number of products from China that exceed 10% and 50% market share
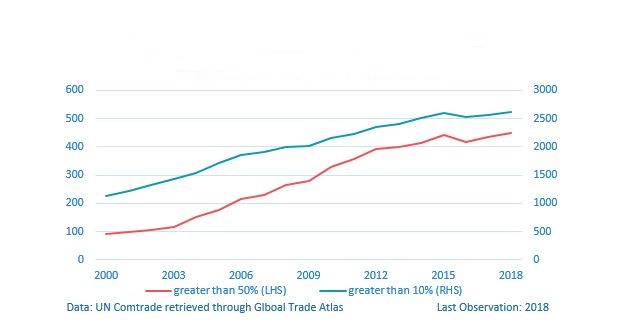
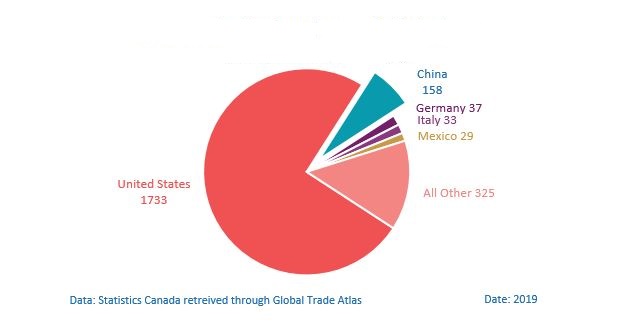
During the Covid-19 epidemic, the Office of the Chief Economist developed a framework for identifying products with limited international supply from Canada’s perspective. Unsurprisingly, it found that United States was the top supplier for the lion’s share of the products; however, China was the top supplier for 158 of the products. This means that Canada is largely dependent on China for the supply of these products. Using import data at the HS-10 level (about 10,000 products), a product was considered to have limited supply for Canada if Canada imported the product from 3 or less supplier countries, or if the HHI is greater than 0.81 (which roughly indicates 90% market share from a single source). The first condition narrows down the list of products to those for which finding a substitute may be difficult for Canada. The second condition identifies the cases where there is an extreme import supplier concentration, but many smaller countries contribute a small amount. The final list had 2,315 products in 2019, and 2,550 products in 2018.30
Figure 8: Distribution of Canada’s limited supply products by top supplier
In addition to the 158 limited supply products for which China was the top supplier, China was an important supplier for another 45 of the limited supply products.31 China is considered an important supplier if (a) the product is already on the limited supply list and (b) China has at least 10% market share. This identifies the cases where there is only one or two other partner countries and China still has a substantial share. For example, in HS-7305120024—a specific product related to pipelines—China has a share of 49%. There is only one other supplier that has a share of 51%. However, it would likely be difficult to find a substitute for China’s 49% of the product supply. The other case is when there is a dominant share, but China still makes up a sizable portion of the product supply. For example, HS-6006232000—Circular Knit Fabric, Solely Of Cotton—the U.S. has a share of 87%, China has a share of 11%, and Italy has a share of 2%. Although the U.S. is clearly a much more important supplier for this product, the 11% China provides seems important when there is seemingly only one real alternative for providing a substitute.32
Examining Chinese exports to the world and Canadian imports of Chinese goods in isolation have issues. For instance, just because China exports the product does not mean Canada imports it, or, in the event Canada does import the product, that it imports it from China. Similarly, in the event that Canada imports a product solely from China, this may be for convenience and not of necessity. Examining the products at the intersection of both pieces of analysis helps resolve these issues.33 The intersection indicates that there are products that Canada imports where China is the dominant supplier, or at least an important share, and given that China makes up the majority of the worlds exports in the product, a substitute may be difficult to obtain. While there is nothing special about China having a 50% threshold, it seems like a natural cut off.34 There are 108 limited supply import products, representing just under $2.4 billion in value, where China is at least half of the world’s market. Of the 108 products, China’s share of Canada’s imports is greater than 90% in 89 of them. Of particular interest is HS-95—Toys, Games, and Sports Equipment. There are 9 products in the list of 108 within HS-95, representing $1.2 billion worth of imports, and China has a share of the Canadian market of at least 90% in all 9 of them. HS-95 also has the 3 largest products by value at the HS-10 level on the list.
Given figure 2, which says 41% of imports from China are in consumption goods, it is not surprising to see a category such as “Toys, Games, and Sports Equipment” be the products for which Canada is most dependent on China. Given the likelihood that these products are final consumption goods, there would be little further supply chain effects from losing these products. In the same vein, these are the imports that people enjoy in their everyday life. It is possible that there could exist substitutes for these products, but only at a (likely significant) increase in cost. In either case, there would be a significant loss of consumer welfare from losing access to these goods. Other products that have sizable contributions are: furniture and bedding ($236 million); electrical machinery ($146 million); and plastics ($125 million).
Supply and Use Analysis
This section looks at the uses of Chinese imports in the Canadian economy to examine Canada’s reliance on Chinese inputs in domestic production. There are a few dimensions for analyzing Canada’s reliance on a foreign country. For a given value of imports, there could be many industries that use low content (large extensive margin and small intensive margin), or it could be that only a few industries use high content (small extensive margin and high intensive margin). To add a dimension, there could be many products at a low value, or a few products at a high value. In terms of Canada’s imports from China, although all industries use Chinese content at a lower value, it is the same products that appear repeatedly that make up a high value.
The Canadian Supply and Use Tables represent how 470 products and 233 industries interact to create the output of the Canadian economy. A product can be produced domestically or it can be imported. Products can then be used as intermediate inputs to the industries, or can be used as final demand (consumption, gross fixed capital formation, inventory investment, or exported). These tables allow for an examination of how Chinese imports are used in the Canadian economy. Using the 2016 Supply and Use Tables, $12.7 billion, or 31%, of the imports from China were in consumer goods. Consumer goods affect the welfare of Canadians directly, whereas the imports of capital and intermediate goods only impact welfare indirectly through production. A loss of imports in consumer goods hurts the Canadian consumer through higher prices, if the goods are even available elsewhere. As was seen with the limited supply products, certain consumption goods (such as “Toys, Games, and Sports Equipment”) are not readily available from other producers and these would be difficult to replace.
$4.5 billion, or 12%, of Canada’s imports from China were capital goods—that is, tangible goods that are instrumental in producing goods and services. Almost all of the capital goods imports went into machinery and equipment, for both industry and government. Two products make up over $2.3 billion of the imports: namely, computers, computer peripherals, and parts; and other communications equipment. These imports are roughly 16% and 30%, respectively, of the total Canadian market for these capital inputs (including those made domestically and imported). Given the importance of both computers and communications equipment, losing either of these capital inputs could cause significant damage to the Canadian economy.
Figure 9: Almost 50% of Canada's production inputs have some Chinese content
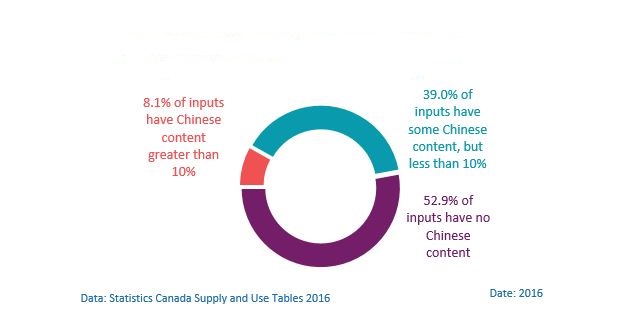
Intermediate goods are the last classification of imports and are perhaps the most interesting.35 Using the most detailed level of the Supply and Use Tables, there is a possibility of 110,000 combinations (470 products x 233 industries) of inputs being used to make outputs. Of course many industries do not use every product in production (for example, the oil sands extraction industry doesn’t use any canola as an intermediate input); eliminating the zeros leaves 46,260 product-industry combinations. A Chinese import is used in 21,793, or 47%, of these combinations. Of these combinations, 3,764 (or 8% of all combinations) have Chinese content of the input greater than 10%, or what this study considers to be significant Chinese content.36
The framing of these numbers is important. In the Supply and Use Tables there are only 470 products, so there is not very much detail and it is not possible to identify which inputs are substitutable and which inputs are necessary while being exclusively Chinese. It could be that a large number of the 21,793 combinations could substitute the Chinese content for an import from another country, or even a domestic input. While a lower number of combinations contain significant Chinese content, it is important to consider all combinations. It is possible that a low value import is essential for the entire production process. An old adage in the auto industry is that it takes 2,500 inputs to make a car, and only 1 input to not make a car. In this spirit, individual inputs should not be dismissed even if they have low value. Table B in the graphical appendix examines the industries that use the highest share of Chinese inputs, and figures M and N display the information graphically for two of the sectors.
Much like the examination of consumer goods, the existence of a suitable replacement does not mean that Canada is just as well off importing from a different country. Assuming that Canadian firms aim to minimize costs, they have chosen the cheapest way to produce their goods. Any disruption to trade that involves firms involuntarily substituting away from the 21,793 Chinese inputs could cause the cost of production to increase, a decrease in productivity, and ultimately hurt Canadian producers and consumers.
The next part of the analysis is to examine which Chinese inputs are used by the industries. Table C in the graphical appendix shows that there are 32 products that Canada imports from China that are used by almost all industries. Canada imports 330 products from China, but not all of them are used extensively. The median product (of the 330) is used by 37 industries, or used by roughly 1 in 6 industries. On the top end, however, there are 32 products that are inputs into at least 200 industries (out of 233). When indirect effects are considered (such as how output from one industry can be used as input into another), then the breadth of Chinese inputs reaches even more production in Canada, indicating that almost surely all Canadian industries rely on Chinese inputs.
To focus the analysis further, the number of Canadian industries where the input contains at least 10% Chinese content is considered. 34 products meet this criterion in at least one industry. The top 10 inputs surpass this criterion for over 200 industries each. Therefore, almost all industries rely significantly on these 10 inputs from China. Similar to the rest of the supply-use results, it is unclear whether these inputs have a substitute elsewhere in the world, but mild economic assumptions would say that substituting away from the Chinese inputs would at the very least affect firms’ cost minimization and productivity.
| Input | Number of sectors (out of 233) it is a significant* input | Average Chinese content of input across sectors |
|---|---|---|
| Hand tools | 227 | 23% |
| Electrical equipment | 227 | 16% |
| Computers and parts | 227 | 16% |
| Miscellaneous manufactured products | 227 | 11% |
| Plastic products | 227 | 10% |
| Small electric appliances | 226 | 36% |
| Lighting fixtures | 225 | 28% |
| Leather and allied products | 224 | 27% |
| Office supplies | 221 | 12% |
| Major appliances | 216 | 15% |
*Significant is defined as at least 10% Chinese content
Data: Statistics Canada Supply and Use Tables 2016
Of the list of 10 inputs, small electric appliances are likely the most important. These inputs contain over 10% Chinese content in 226 industries, out of 233. The average Chinese content of small electric appliances across all industries is 36%. Put another way, 97% of all industries use small electric appliances where over one-third of their input comes from China. Focusing the analysis a little further, and using the methodology of the previous section, there are 47 products at the HS-10 level that go into small electric appliances. Of these 47, 9 are on the limited supply list, and all 9 have China as the top supplier. Furthermore, for 6 of the 9 products, China makes up more than 60% of the world’s share of exports.37 All of these factors taken together suggest that substitutes for small electric appliances that come from China would be difficult to replace and quite expensive, if they exist at all.
Exports
While most of this analysis has focused on the importance of China due to the imports they provide, China is the second largest consumer market after only the United States and is thus a large export market for Canada. Perhaps the biggest benefit that exports provide to an economy is they allow for productive firms to produce more than they would have otherwise, thus increasing productivity and employment. Statistics Canada does not estimate directly the number of jobs linked to exporting to China; however, they do provide estimates for total jobs supported by exporting and jobs supported by exporting to the United States based on the value added exports for each industry. An important caveat is that the numbers do not imply that exporting has created these jobs—which suggests that importing costs jobs—it simply states the number of jobs that are linked to exporting.
Assuming that the Chinese share of Canadian exports (excluding the U.S.) by industry is the same as the Chinese share of jobs due to exporting, it is possible to estimate the number of jobs linked to exporting to China. Using the 2016 Supply and Use Tables, there were 18,435,405 jobs in the economy; 3,273,221 jobs (about 1 in 6) were supported by exports and 2,204,872 were embodied in exports to the United States. Using this framework, it is estimated that 182,026 jobs were embodied in exports to China, or about 1% of all jobs in Canada.
Conclusion
This study has explored Canada’s evolving and complex commercial relationship with China. China is Canada’s second largest bilateral trading partner and the economies are thoroughly interconnected. Canadian imports and exports with China are diverse, and are at roughly the same level of complexity. While two-way investment flows have grown considerably in the last decade, this part of the relationship remains small relative to the rest of the world. This paper has identified key products and inputs for which Canadian consumers and firms are heavily reliant on Chinese imports, and for which substitutes may be difficult to find. While the benefits of trade tend to focus on exports, it is import to recognize that Canadians benefit from lower prices by importing consumer goods from China, and many products—particularly electrical equipment—are important for Canadian producers.
References
- Agarwal, Isha, Grace Weishi Gu, and Eswar S Prasad. China’s impact on global financial markets. Technical report. National Bureau of Economic Research, 2019.
- Alvaredo, Facundo, Lucas Chancel, Thomas Piketty, Emmanuel Saez, and Gabriel Zucman. World inequality report 2018. Belknap Press, 2018
- Chan, Chris King‐Chi, and Khalid Nadvi. "Changing labour regulations and labour standards in China: Retrospect and challenges." International Labour Review 153, no. 4 (2014): 513-534.
- Chor, Davin, Kalina Manova, and Zhihong Yu. Growing Like China: Firm Performance and Global Production Line Position. No. w27795. National Bureau of Economic Research, 2020.
- Global Affairs Canada, Canada’s State of Trade: Trade and Investment Update 2019 (2019).
- Government of Canada, Trade Data Online, Retrieved from https://www.ic.gc.ca/eic/site/tdo-dcd.nsf/eng/Home Accessed: 2020-06-01.
- Fang, Tony, Caroline Gunterberg, and Emma Larsson. "Sourcing in an increasingly expensive China: Four Swedish cases." Journal of Business Ethics 97, no. 1 (2010): 119-138.
- Hausmann, Ricardo, Jason Hwang, and Dani Rodrik. "What you export matters." Journal of economic growth 12, no. 1 (2007): 1-25.
- Nam, Kyung-Min, Caleb J Waugh, Sergey Paltsev, John M Reilly, and Valerie J Karplus. “Carbon co-benefits of tighter SO2 and NOx regulations in China.” Global Environmental Change 23, no. 6 (2013): 1648–1661.
- OECD. “Gross domestic product,” 2019. https://www.oecd-ilibrary.org/content/data/data-00001-en.
- OECD. “Trade in Value Added (TiVA) 2016” [in English].OECD Quarterly International Trade Statistics 2017, no. 1 (2017): 95–113..
- OECD. “Trade in Value Added (TiVA) 2018” [in English].OECD Quarterly International Trade Statistics 2018, no. 2 (2019): 97–106.
- Statistics Canada merchandise trade customs basis, retrieved through Global Trade Atlas on June 1st 2020.
- Statistics Canada. Table 12-10-0143-01 International merchandise trade by Broad Economic Categories and top sixty trading partners (x 1,000).
- Statistics Canada. Table 36-10-0007-01 International transactions in services, by selected countries, annual (x 1,000,000).
- Statistics Canada. Table 36-10-0008-01 International investment position, Canadian direct investment abroad and foreign direct investment in Canada, by country, annual (x 1,000,000).
- Statistics Canada. Table 36-10-0023-01 Balance of international payments, current account, goods by principal trading partners, quarterly (x 1,000,000).
- Statistics Canada. Table 36-10-0024-01 Balance of international payments, current account, services by principal trading partners, quarterly (x 1,000,000).
- Statistics Canada. Table 36-10-0361-01 International investment position, Canadian portfolio investment abroad at market value, by country, annual (x 1,000,000).
- Statistics Canada. Table 36-10-0445-01 Activities of multinational enterprises in Canada, foreign multinationals, by immediate and ultimate investor country.
- Statistics Canada. Table 36-10-0470-01 Activities of Canadian multinational enterprises abroad, by countries.
- Statistics Canada. Table 36-10-0478-01 Supply and use tables, detail level, provincial and territorial (x 1,000)
- Statistics Canada. Table 37-10-0086-01 Postsecondary enrolments, by status of student in Canada, country of citizenship and gender.
- UN Comtrade, China Customs, various government statistical agencies; retrieved through Global Trade Atlas on June 1st 2020.
- “World Economic Outlook Database - October 2019 Edition.” World Economic and Financial Surveys. International Monetary Fund, October 2019. imf.org/external/pubs/ft/weo/2019/02/weodata/index.aspx.
Appendix
The complexity, or income level, of the goods traded was calculated in the way suggested by the paper “what you export matters”.38 This appendix will provide a brief summary of their method. Let countries be indexed by j, and goods be indexed by l. The exports of country j are thus:

Next the productivity (i.e. complexity) associated with each good is defined as:

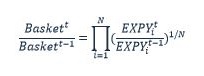
Where Yj is the per-capita GDP of country j. Thus, the complexity of each good is sum over all of the shares of the export in country j’s export basket, multiplied by the per-capita income of country j, divided by the sum of the shares. Another way of writing the PRODY is to sum over the revealed comparative advantage of the good for each country, multiplied by the country’s per-capita income. The final step is to sum over the share of goods in the export basket multiplies by the productivity of each good:

The calculations were done with exports at the HS-6 level using UN Comtrade data retrieved through Global Trade Atlas, and GDP-per-capita in current U.S. dollars retrieved through the IMF world economic outlook (WEO) October 2019. Because the GDP-per-capita is in current U.S. dollars, U.S. inflation is inherently built into each series. To construct the reference basket I use a Jevons index—an unweighted geometric mean of relative changes—of 10 countries’ export basket complexity.
The 10 countries selected for the reference basket were Germany, USA, UK, Australia, Japan, South Korea, New Zealand, France, Sweden, and Norway. The reference basket was started at both the level of Canada in 2000 and the level of China in 2000 for ease of comparison.
Graphical Appendix
Figure A: Imports from and exports to China, shares of non-U.S. trade, 2000-2019

Data: Statistics Canada Balance of Payments Last Observation: 2019
Source: Office of the Chief Economist, Global Affairs Canada
Figure B: Canadian merchandise exports to China by HS-1 product

*Clocks, Watches, and Specialized Instrumentation
Data: Statistics Canada retrieved through Trade Data Online Date: 2019
Source: Office of the Chief Economist
Figure C: Diversity of Canadian exports by product to top 10 trading partners in 2019

Data: Statistics Canada retrieved through Global Trade Atlas Date: 2019
Source: Office of the Chief Economist
Figure D: Canadian merchandise imports from China by HS-1 product
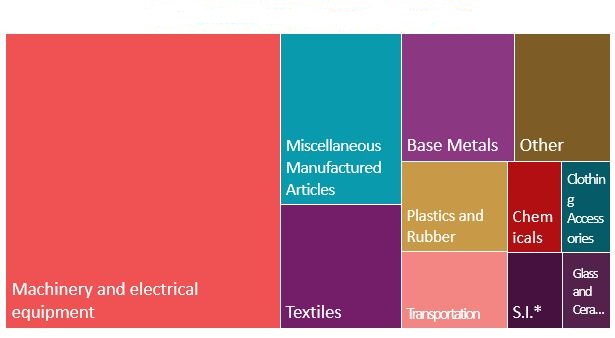
*Clocks, Watches, and Specialized Instrumentation
Data: Statistics Canada retrieved through Trade Data Online Date: 2019
Source: Office of the Chief Economist
Figure E: Diversity of Canadian imports by product from top 10 trading partners in 2019

Data: Statistics Canada retrieved through Global Trade Atlas Date: 2019
Source: Office of the Chief Economist
Figure F: Overall export complexity (the income level of exports) and comparison to a reference basket

Data: UN Comtrade retrieved through Global Trade Atlas; and IMF WEO Last Observation: 2018
Source: Office of the Chief Economist
Figure G: Travel spending by Canadians in China, and Chinese in Canada
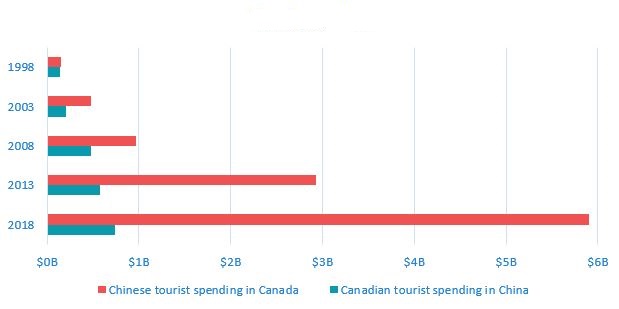
Data: Statistics Canada
Figure H: Employment in China by Canadian MNE’s and Employment in Canada by Chinese MNE’s
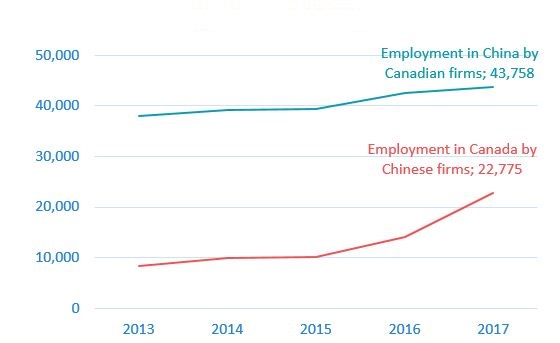
Data: Statistics Canada
Figure I: Value of sales by MNE’s in China and Canada

Data: Statistics Canada
Figure J: China’s share of world exports in electronics where they have at least 60% market share
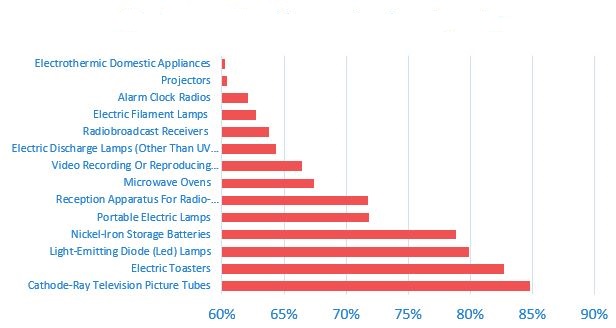
Data: UN Comtrade retrieved through Global Trade Atlas Date: 2018
Figure K: China’s share of world exports in inorganic chemicals where they have at least 60% market share

Data: UN Comtrade retrieved through Global Trade Atlas Date: 2018
Figure L: China’s share of world exports in woven fabrics where they have at least 60% market share

Data: UN Comtrade retrieved through Global Trade Atlas Date: 2018
| Sector | China top supplier | China Important supplier | Total products |
|---|---|---|---|
| Agriculture | 34 | 7 | 863 |
| Chemicals & Fertilizers | 23 | 8 | 338 |
| Clothing & Textiles | 19 | 6 | 122 |
| Electronics | 13 | 6 | 34 |
| Fuels | 1 | 62 | |
| Machinery | 9 | 2 | 78 |
| Metals & Minerals | 15 | 9 | 316 |
| Misc. Manufactures | 26 | 1 | 72 |
| Pharmaceutical Products | 0 | 0 | 14 |
| Plastics & Rubber | 2 | 0 | 19 |
| Transport Equipment | 1 | 2 | 60 |
| Wood & paper | 15 | 3 | 122 |
| Other | 1 | 0 | 215 |
| Total | 158 | 45 | 2315 |
Data: Statistics Canada retrieved through Global Trade Atlas Date: 2019
| Industry | Chinese Share of Inputs | Total number of inputs | Number of Chinese Inputs | Number of Chinese Inputs >10% |
|---|---|---|---|---|
| Electric lighting equipment manufacturing | 11.0% | 199 | 70 | 15 |
| Computer and peripheral equipment manufacturing | 6.4% | 178 | 38 | 10 |
| Communications equipment manufacturing | 6.4% | 211 | 87 | 19 |
| Household appliance manufacturing | 6.3% | 178 | 55 | 14 |
| Other furniture-related product manufacturing | 5.6% | 200 | 68 | 17 |
| Motor vehicle electrical and electronic equipment manufacturing | 5.1% | 187 | 63 | 14 |
| Textile and textile product mills | 5.0% | 222 | 98 | 21 |
| Clothing and leather and allied product manufacturing | 5.0% | 210 | 91 | 18 |
| Office furniture (including fixtures) manufacturing | 4.8% | 213 | 100 | 20 |
| Funeral services | 4.7% | 181 | 72 | 14 |
Data: Statistics Canada Supply and Use Tables 2016
Figure M: Inputs into electric lighting equipment manufacturing

Data: Statistics Canada Supply and Use Tables 2016
Figure N: Inputs into office furniture manufacturing

Data: Statistics Canada Supply and Use tables 2016
| Product | Number of sectors | Product | Number of sectors |
|---|---|---|---|
| Plastic products, n.e.c. | 228 | Threaded metal fasteners and other turned metal products including automotive | 221 |
| Hand tools, kitchen utensils and cutlery (except precious metal) | 227 | Office supplies (except paper) | 221 |
| Computers, computer peripherals and parts | 227 | Batteries | 219 |
| Other electrical equipment and components | 227 | Air passenger transportation services | 217 |
| Other miscellaneous manufactured products | 227 | Major appliances | 216 |
| Printed products | 226 | Agricultural, lawn and garden machinery and equipment | 214 |
| Fabricated metal products, n.e.c. | 226 | Other architectural metal products | 212 |
| Small electric appliances | 226 | Other miscellaneous general-purpose machinery | 212 |
| Room or unit accommodation services for travellers | 226 | Office administrative services | 211 |
| Other converted paper products | 225 | Glass (including automotive), glass products and glass containers | 210 |
| Telephone apparatus | 225 | Metal valves and pipe fittings | 210 |
| Lighting fixtures | 225 | Other published products | 207 |
| Suitcases, handbags and other leather and allied products | 224 | Paperboard containers | 206 |
| Heating and cooling equipment (except household refrigerators and freezers) | 224 | Paper office supplies | 203 |
| Chemical products, n.e.c. | 223 | Motor vehicle rental and leasing services | 201 |
| Wiring devices | 222 | Prepared meals | 201 |
Data: Statistics Canada supply and use tables 2016
