風蕭蕭_Frank
以文會友


末日來臨:北大西洋經濟的演變和全球危機
https://www.rba.gov.au/publications/confs/2011/bayoumi-bui.html
Tamim Bayoumi 和 Trung Bui[*] 澳大利亞儲備銀行年度會議 – 2011
1. 簡介
2008 年底席卷全球經濟的金融危機源於美國房地產市場的過度繁榮。然而,其影響波及全球,西歐尤為明顯。事實上,歐元區外圍國家的問題繼續使西歐陷入金融動蕩,從許多方麵來看,這些影響仍然存在。本文試圖從更廣泛的曆史視角來解釋這些發展,以了解近幾十年來北大西洋經濟(包括北美和西歐)的演變。我們將論證,盡管貿易聯係相對停滯,但競爭加劇和監管政策不同導致金融聯係日益緊密,從而在世界兩大地區之間建立了一種獨特的緊密金融關係,這種聯係是將美國衝擊轉移到全球衝擊中的關鍵渠道(見 IMF (2011))。
本文的下一部分將通過追蹤北大西洋兩岸貿易和金融聯係的演變奠定基礎,並討論推動金融聯係日益緊密的因素。接下來,我們將研究北大西洋兩岸及其三大組成部分——美國、歐元區和英國——之間的全球增長溢出效應的實證證據,特別關注我們對這些溢出效應的理解如何因危機而改變,以及如何將這些結果映射到宏觀經濟模型模擬中,重點是如何模擬金融聯係。
2. 北大西洋貿易和金融聯係的演變
當宏觀經濟學家考慮跨地區的經濟聯係時,他們自然會傾向於貿易。跨經濟體的商品和服務直接轉移是某個地區實際經濟發展影響另一個地區最明顯的方式。當然,這其中也存在一些複雜因素。特別是,中間產品複雜的跨境供應鏈的發展意味著,僅僅關注美國和德國之間的雙邊貿易已不再可能。雖然這些問題在亞洲最為突出,但在北美(鑒於美國、加拿大和墨西哥之間的北美自由貿易協定 (NAFTA))和歐洲(鑒於柏林牆倒塌、單一市場和歐元引入後東歐和西歐重新整合,促進了一體化),這些問題也變得越來越突出。
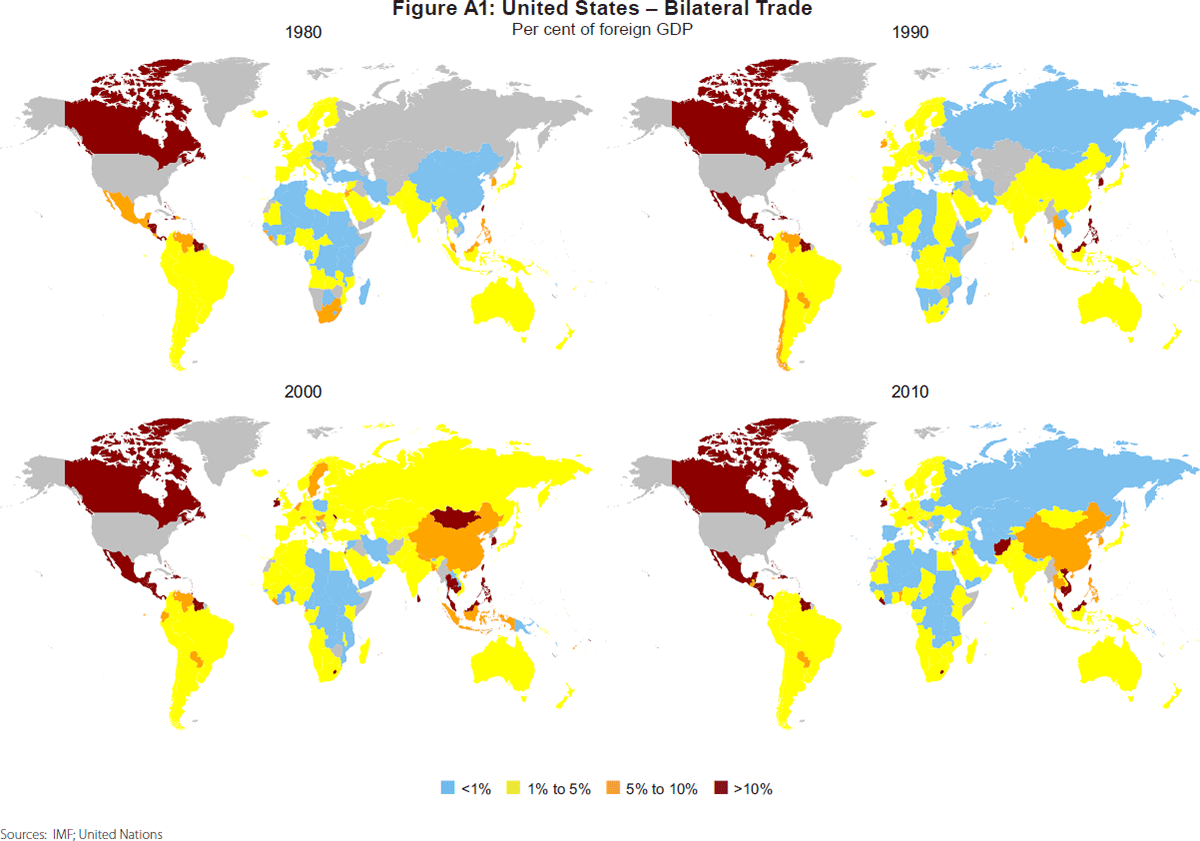
然而,即使考慮到北美和西歐內部的這些發展,北大西洋貿易數據給人的整體印象仍然是停滯不前。圖 A1 顯示了 1980 年、1990 年、2000 年和 2010 年美國與世界其他國家之間的貿易聯係熱圖。雙邊出口和進口以接受國 GDP 的比率來報告。選擇美國作為關注中心,是因為它仍然是北美貿易體係的樞紐(見 Riad 和 Saborowski (2011))。由於歐洲沒有類似的主導樞紐,它可能是分析北大西洋貿易體係的最佳節點。這些熱圖表明美國貿易隨時間發生了重大變化,但這種活力的中心不在西歐。相反,它在北美和亞洲。與這些不斷發展的關係相比,跨北大西洋的貿易似乎相對固定。
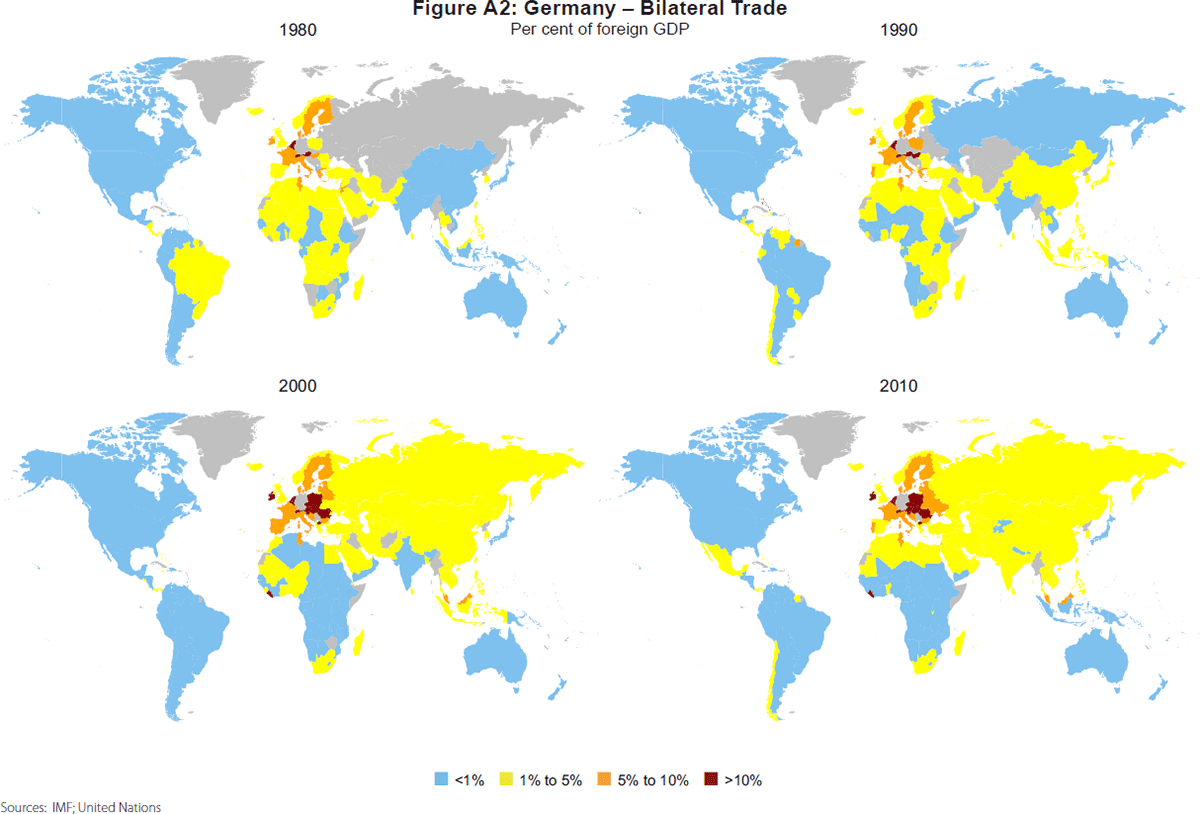
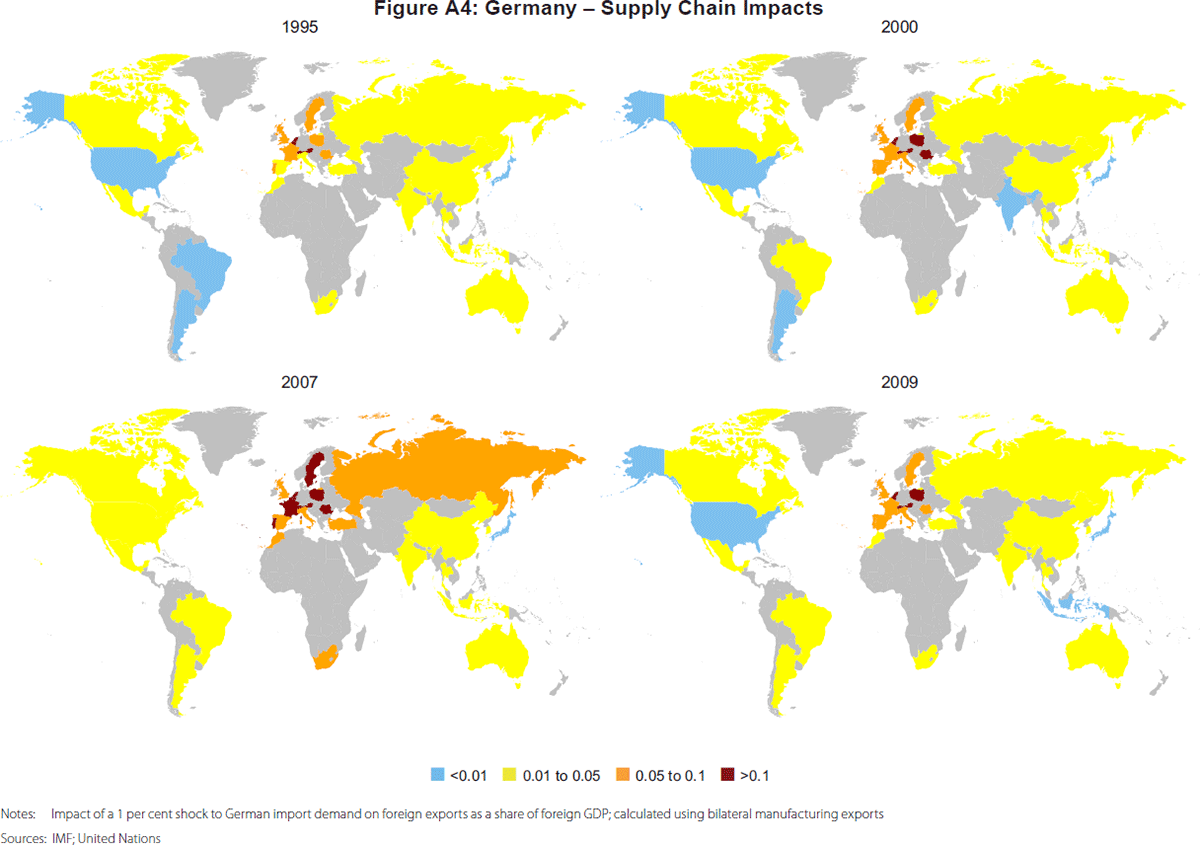
圖 A2 顯示了歐元區出口樞紐德國的同等結果。同樣,這些熱圖生動地說明了西歐,特別是東歐不斷增長的供應鏈作為貿易動態驅動力的重要性。但它們並沒有改變自 1980 年以來北大西洋貿易體係缺乏活力的基本結論。
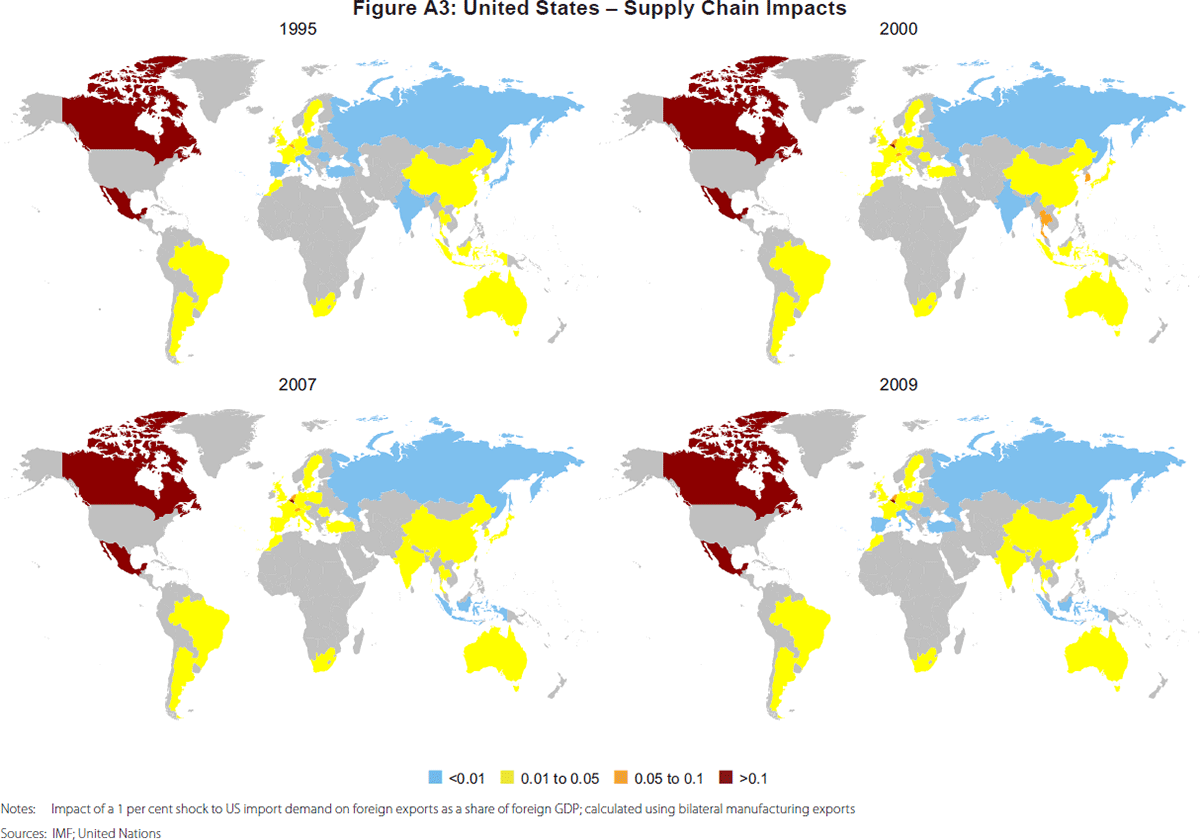
當然,這種缺乏變化的表象可能會忽略通過供應鏈進行的更微妙的聯係。因此,圖 A3 和 A4 重複了這一過程,但隻關注製造業貿易,並使用 Vidon (2011) 中討論的方法考慮了完整的國際貿易聯係網絡。[1] 簡而言之,以接受國 GDP 為衡量標準的各國雙邊出口的完整矩陣計算為矩陣 X。現在,如果 A 國的需求下降,這反過來意味著(比如說)B 國對 A 國的出口下降,從而導致 B 國的需求下降。B 國需求下降的影響將傳遞到其貿易夥伴。很容易證明,如果假設全球出口需求彈性固定為 α,那麽影響就是 (I – α X)−1(在圖 A3 和 A4 中,假設該彈性為 1)。從圖中可以看出,增加供應鏈對 A 國的影響很小
基本情況是——北大西洋貿易仍處於相對停滯狀態。
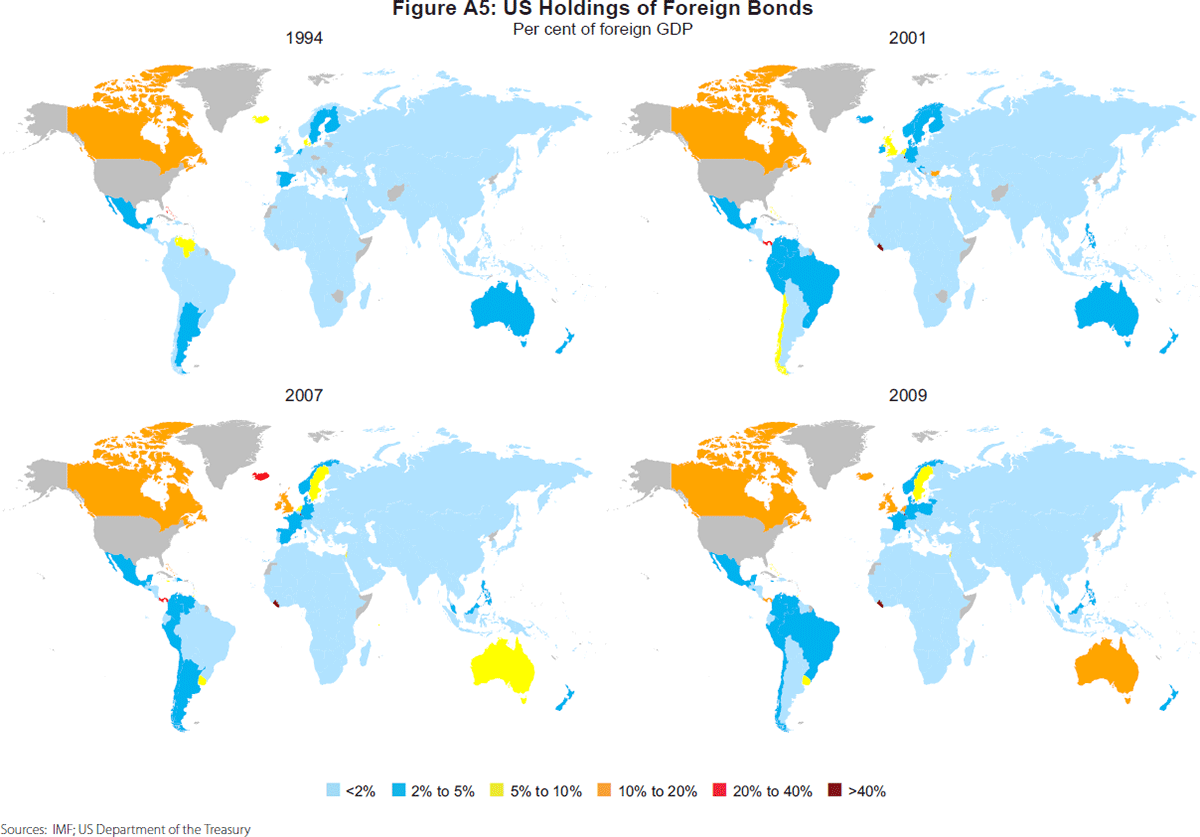
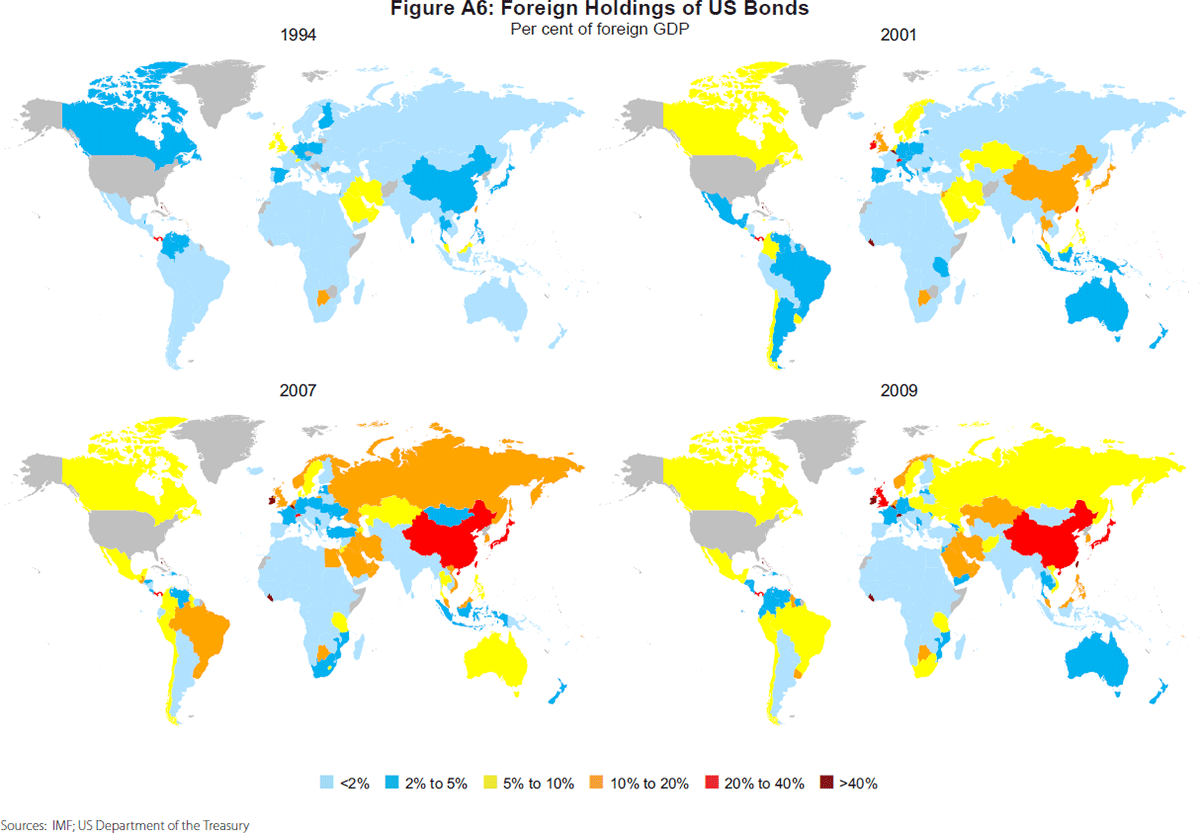
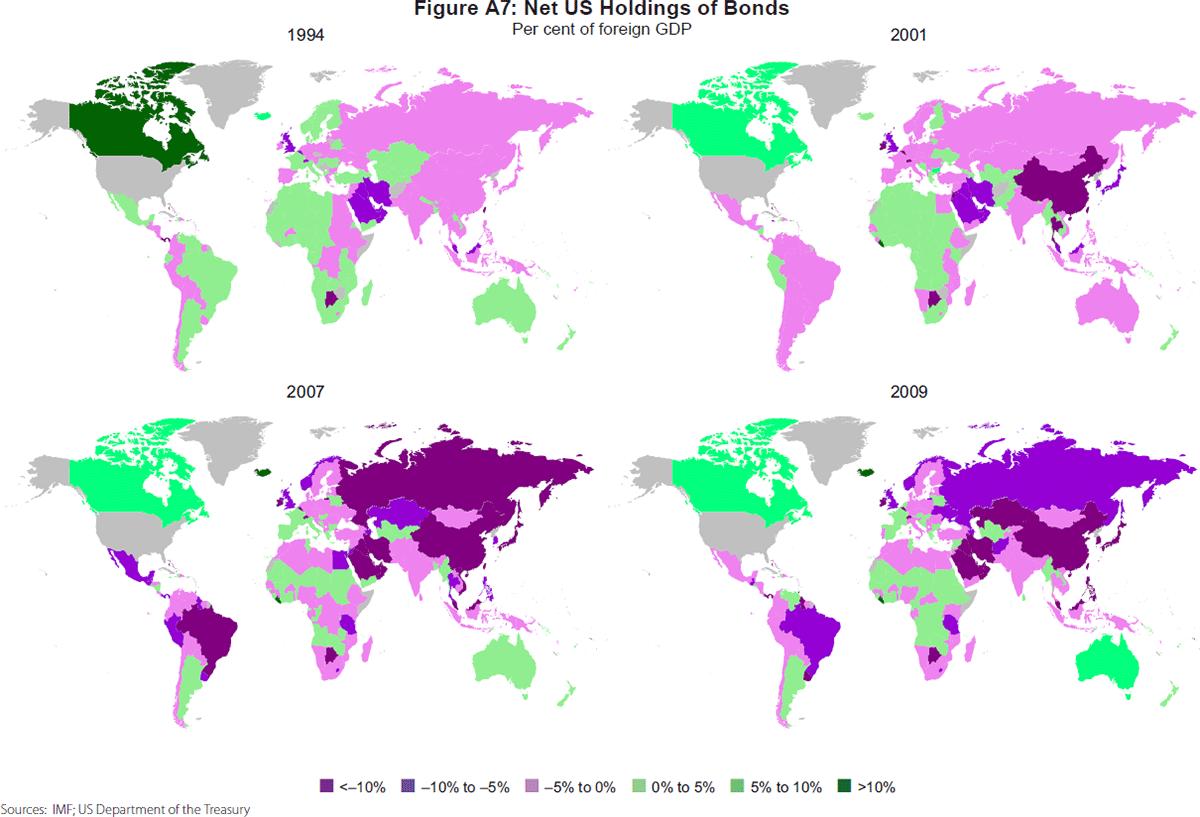
然而,就資產持有量和銀行關係而言,金融聯係的情況截然不同,而且更加動態。從資產持有量開始,圖 A5-A7 顯示的熱點圖與圖 A1 中的類似,不同之處在於它們分別衡量美國持有的外國債券存量、外國持有的美國債券存量和淨頭寸,均以外國 GDP 的百分比表示。同樣,美國被置於分析的中心,但在這種情況下是因為數據的可用性。這些關於雙邊資產持有量的數據來自美國財政部國際資本係統 (TIC) 數據庫。西歐(或其他任何地方)沒有同等長期的雙邊資產持有量曆史數據——盡管最近國際貨幣基金組織 (IMF) 的協調投資組合投資調查提供了更廣泛的國家數據,但覆蓋範圍更有限(例如,不包括官方持有量)。我們從 1994 年開始繪製熱圖,這是最早可獲得合理概括數據的日期,同時還報告了 2001 年、2007 年(危機前夕)和 2009 年的情況。
從圖 A5 可以看出,美國持有的外國債券隨著時間的推移而增加,這種增加主要集中在西歐,或者更準確地說,集中在英國、荷蘭和最近的愛爾蘭的金融中心。外國持有的美國債券也隨著時間的推移出現了類似的金融聯係深化,但這種聯係在地理上更為普遍,包括中國、俄羅斯、巴西和中東石油出口國等主要新興市場國際儲備持有者,以及西歐金融中心(圖 A6)。事實上,新興市場往往是美國的主要淨貸款方(圖 A7)。
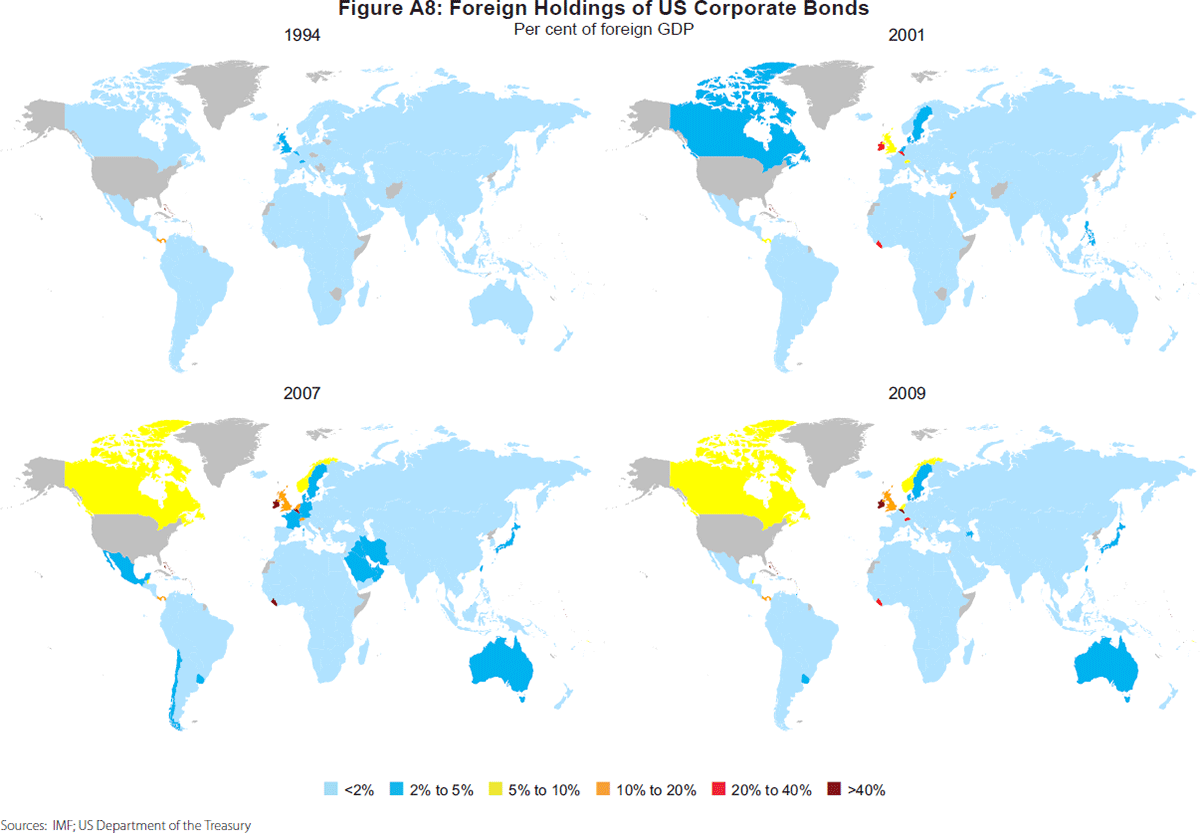
然而,重要的是,西歐金融中心持有的美國資產更多地集中在私人債券上,而不是世界其他地區。 TIC 數據允許進一步劃分雙邊持有的美國政府債券、機構(本質上是房地美和房利美的準公共債券,通常被認為包含隱性政府擔保)和私人債券。圖 A8 顯示了外國持有的公司債券的演變,其格式與圖 A6 中顯示的整體債券相同。美國與西歐金融中心之間聯係的獨特動態演變現在已很明顯;這是世界上一個深度持有各種美國債券的地區,而不是簡單地購買美國國債,因為儲備經理尋求一種價值儲存手段。
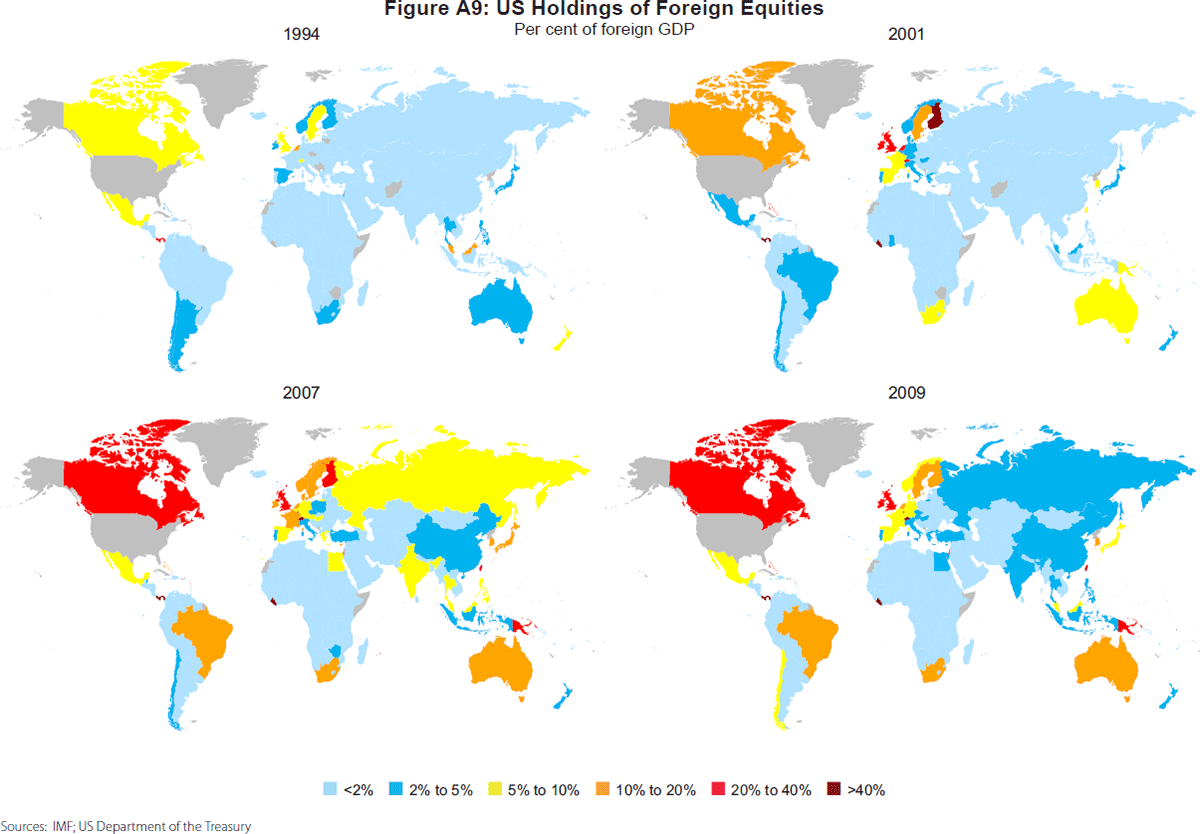
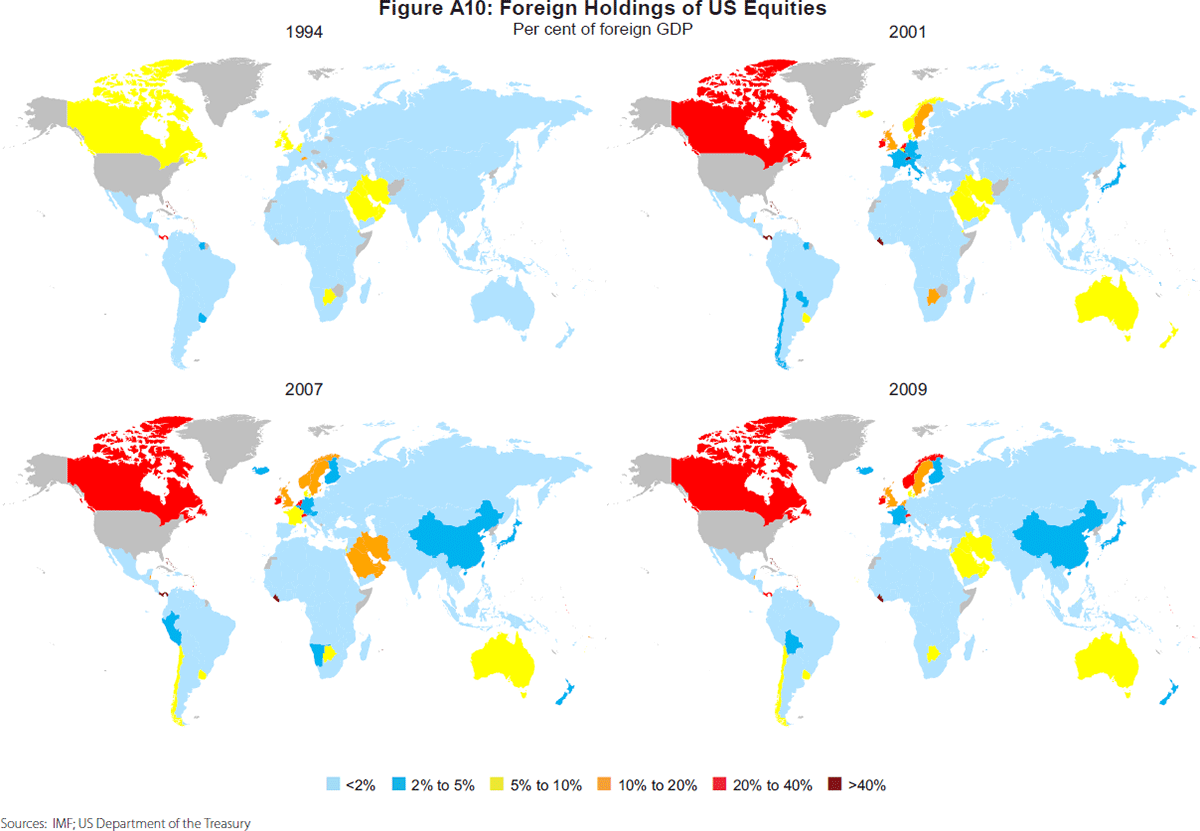
美國和西歐之間的雙邊股票持有也更深。圖 A9 和 A10 顯示了美國和外國股票跨境持有的演變,同樣來自 TIC 數據庫,格式與前四個圖相同。西歐金融中心再次脫穎而出。
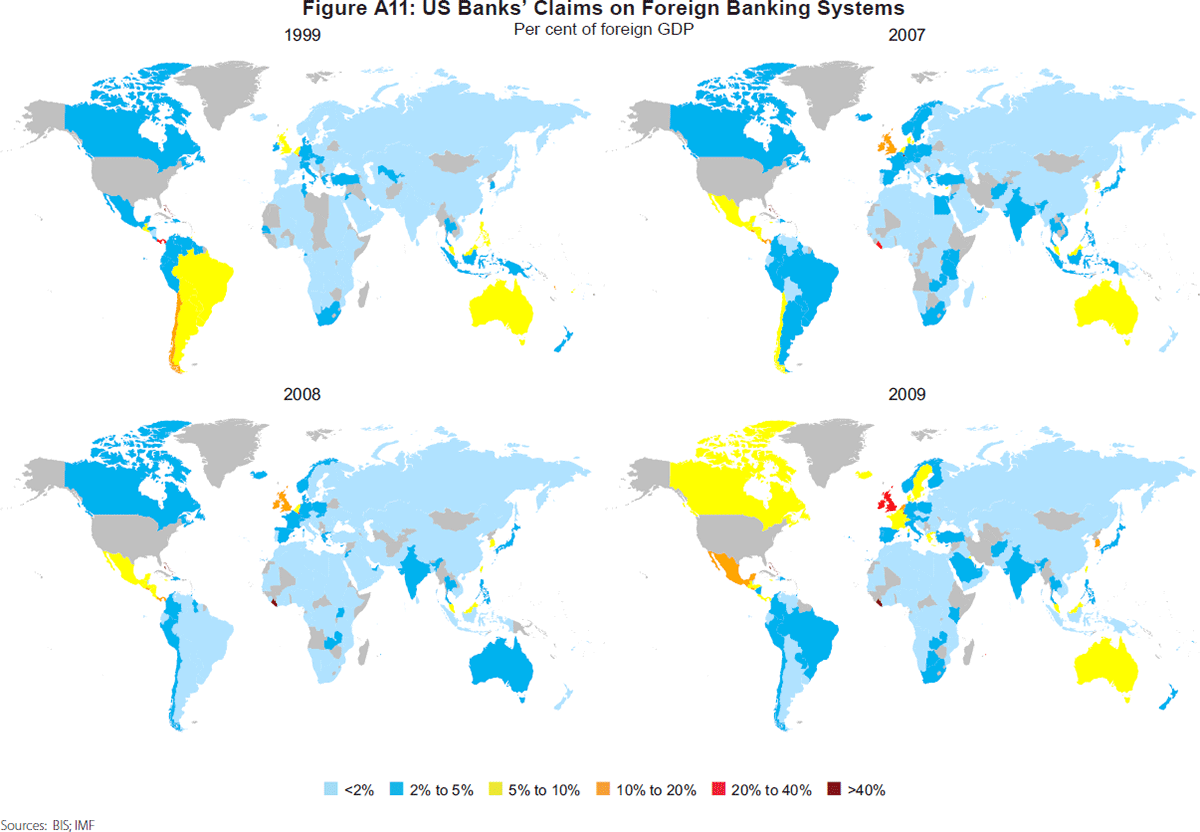
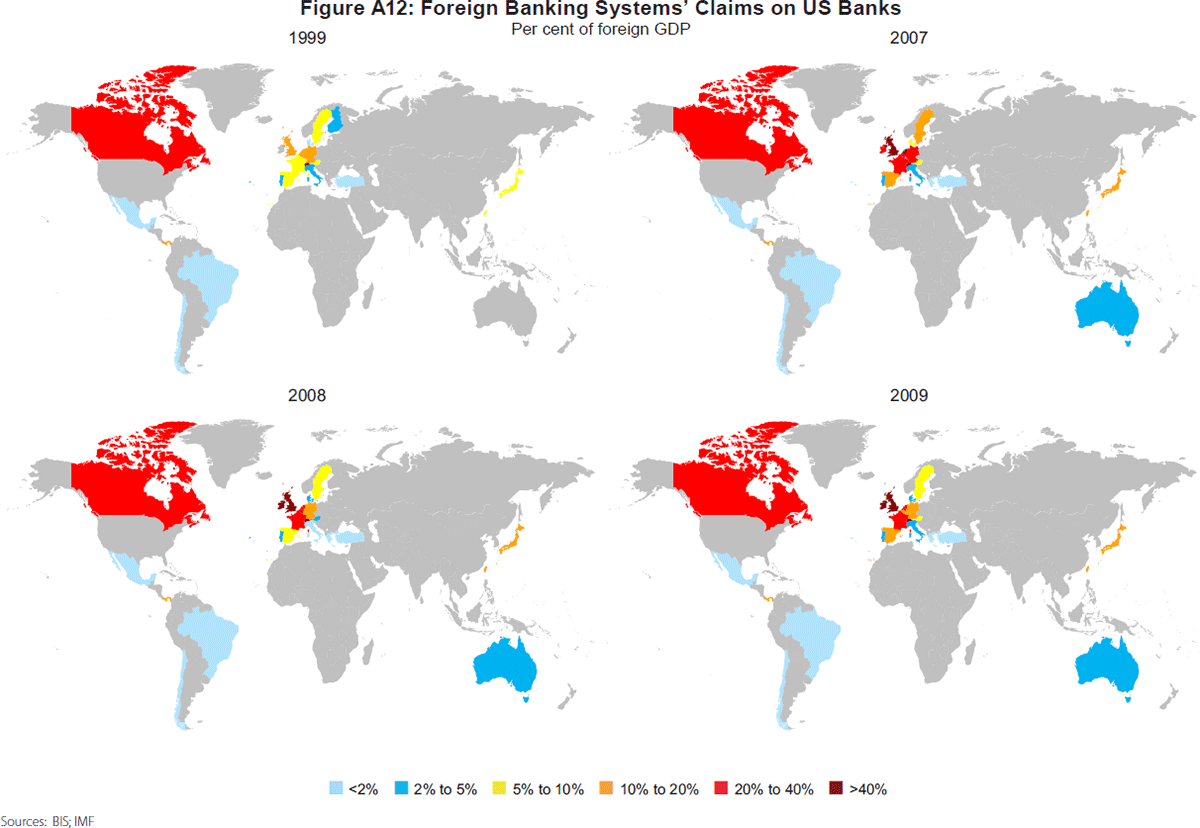
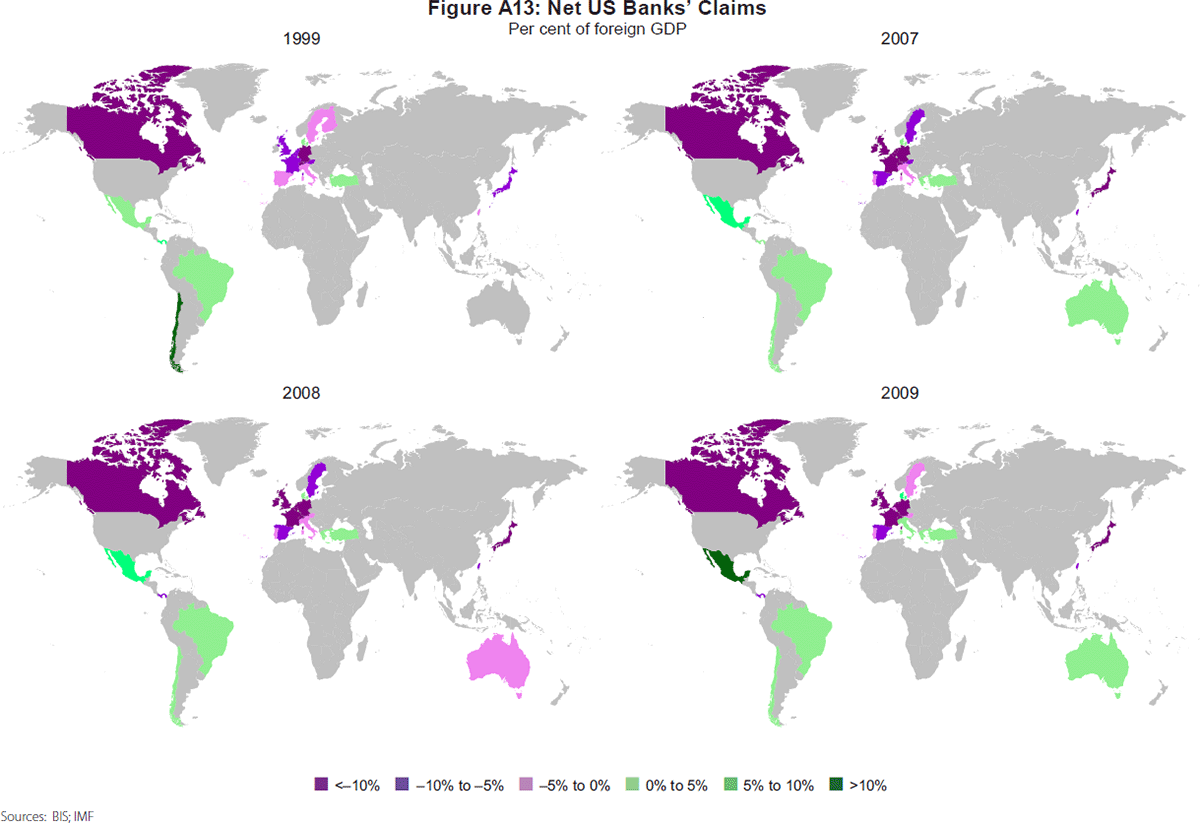
現在我們轉向金融聯係的另一個方麵,即跨銀行的跨境資產持有。這些數據來自國際清算銀行 (BIS),僅提供 1999 年的數據,而且即使如此,覆蓋範圍也很有限。因此,圖 A11-A13 僅顯示 1999 年、2007 年(危機前)、2008 年和 2009 年這些聯係的演變情況。之所以包括 2008 年和 2009 年的數據,是因為 2008 年底美國銀行對其他國家的債權序列出現了重大突破。在此日期之前,調查僅包括美國商業銀行。在此日期之後,包括了美國投資銀行。這一點很重要,因為美國投資銀行(出於監管目的,它們被混淆地算作非銀行,並且隻在批發市場提供資金)已成為美國銀行體係中一股日益重要的力量。經紀自營商的資產(美國資金流量賬戶數據庫中可獲得的美國投資銀行的近似值)隨著時間的推移從 1980 年占商業銀行資產的不到 3% 上升到 2007 年全球金融危機前夕的 30% 左右。雷曼兄弟破產後,由於批發融資麵臨壓力,這一比例減半至目前的 15%。
從美國對外國銀行係統的債權開始,圖 A11 中的故事是,美國與西歐金融中心的最初聯係隨著時間的推移而不斷增加,2009 年美國投資銀行被納入數據後,這種聯係進一步增強。除了北美和一些與美國有特殊聯係的小國之外,這是西歐的趨勢,而不是全球趨勢。談到外國銀行係統對美國銀行的債權(圖 A12),西歐再次脫穎而出,但在這種情況下,故事更為普遍。這些美國債權一直相對較大——尤其是對英國銀行——但隨著美國銀行的債權增加,這種聯係顯著增加。
隨著時間的推移,這種聯係的增加速度比其他具有緊密聯係的銀行體係(如加拿大)更快。因此,21 世紀的繁榮進一步加強了現有的緊密聯係。[2] 然而,同樣引人注目的是這種聯係的不平衡性。西歐銀行與美國銀行體係的聯係比美國銀行與西歐銀行的聯係要多得多(加拿大和日本也是如此)(圖 A13)。
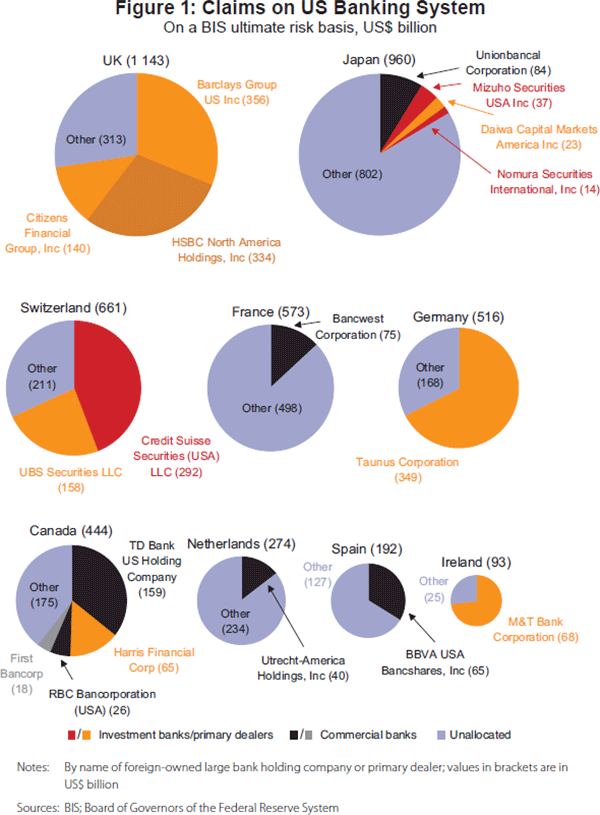
此外,這些聯係的性質與其他銀行體係的聯係截然不同(另見 Bhatia (2011))。從圖 1 可以看出,英國、瑞士、德國和愛爾蘭銀行目前在美國的大量參與反映了它們對美國投資銀行業務的所有權。相比之下,對於加拿大和日本來說,這種聯係主要來自商業銀行(法國和荷蘭也是如此,但這裏有一個問題,因為這些銀行的投資銀行業務是在倫敦而不是紐約進行的)。相關數據顯示,商業銀行的分支機構廣泛分布於美國各地,而投資銀行一般僅在紐約、康涅狄格州或(出於監管原因)猶他州設有辦事處。
***while investment banks generally have a single office in New York, Connecticut, or (for regulatory reasons) Utah.***
Apocalypse Then: The Evolution of the North Atlantic Economy and the Global Crisis
https://www.rba.gov.au/publications/confs/2011/bayoumi-bui.html
Tamim Bayoumi and Trung Bui[*] RBA Annual Conference – 2011
1. Introduction
The financial crisis that struck the global economy in late 2008 had its origins in excesses in the US housing market. Its reverberations, however, were felt around the world and nowhere more keenly than in Western Europe. Indeed, in many ways they are still being felt as problems in the periphery of the euro area continue to mire Western Europe in financial volatility. This paper seeks to explain these developments by taking a wider historical view of the evolution over recent decades of the North Atlantic economy, comprising North America and Western Europe. We will argue that while trade links were in relative stasis, increasing financial ties coming from a combination of greater competition and divergent regulatory policies created a uniquely close financial relationship between these two parts of the world, and that this link was a crucial conduit in siphoning US shocks into global ones (see IMF (2011)).
The next section of this paper lays some groundwork by tracing the evolution of trade and financial links across the North Atlantic, and discusses the forces that drove increasing close financial ties. This is followed by an examination of empirical evidence on global growth spillovers across the North Atlantic and between its three major components – the United States, the euro area and the United Kingdom – with a particular focus on how our understanding of these spillovers has been changed by the crisis, and how these results can be mapped into macroeconomic model simulations, with an emphasis on how to model financial linkages.
2. The Evolution of North Atlantic Trade and Financial Links
When macroeconomists think about economic ties across regions, they naturally gravitate to trade. Direct transfers of goods and services across economies are the most visible way in which real economic developments in one region affect another. There are complications, of course. In particular, the evolution of sophisticated cross-border supply chains in intermediate goods means that it is no longer possible to simply look at bilateral trade between, say, the United States and Germany. While these issues are most pertinent in Asia, they have become increasingly so in North America – given the North American Free Trade Agreement (NAFTA) between the United States, Canada and Mexico – and Europe – given the fillip to integration produced by reintegration of Eastern and Western Europe after the fall of the Berlin wall, the single market and the introduction of the euro.
Even given these developments within North America and Western Europe, however, the overall impression from data on trade across the North Atlantic is one of stasis. Figure A1 shows heat maps of trade links between the United States and the rest of the world from 1980, 1990, 2000 and 2010. Bilateral exports and imports are reported as a ratio of recipient country GDP. The United States is chosen as the centre of focus as it remains the hub of the North American trade system (see Riad and Saborowski (2011)). In the absence of a similarly dominant hub in Europe, it is probably the best node from which to analyse the North Atlantic trade system. These heat maps indicate significant changes in US trade over time, but the centre of this dynamism is not with Western Europe. Rather, it is within North America and with Asia. By contrast with these evolving relationships, the trade across the North Atlantic seems to be relatively fixed.
Figure A2 shows equivalent results for Germany, the centre of the euro area export hub. Again, these heat maps vividly illustrate the importance of growing supply chains in Western and, in particular, Eastern Europe as a driver of trade dynamics. But they do not change the basic conclusion of the lack of dynamism in the North Atlantic trade system since 1980.
It is possible, of course, that this appearance of lack of change misses more subtle linkages through supply chains. Accordingly, Figures A3 and A4 repeat the exercise, but looking only at manufacturing trade and taking into account the full web of international trade links using the methodology discussed in Vidon (2011).[1] Briefly, the full matrix of bilateral exports across countries in terms of recipient GDP is calculated as matrix X. Now, if demand in country A falls, this in turn implies a fall in exports from (say) country B to country A and hence a fall in demand in country B. The impact of this fall in demand in country B will then be propagated across its trading partners. It is easy to show that if you assume a fixed global elasticity of demand for exports of α, then the impact is simply (I – α X)−1 (in Figures A3 and A4 this elasticity is assumed to be unity). As can be seen in the figures, adding supply chains has little impact on the basic story – North Atlantic trade remains in relative stasis.
The story with regard to financial links both in terms of asset holdings and in terms of banking ties, however, is dramatically different and much more dynamic. Starting with asset holdings, Figures A5–A7 show heat maps similar to those in Figure A1, except that they measure stocks of US holdings of foreign bonds, stocks of foreign holdings of US bonds, and the net position, respectively, all as a per cent of foreign GDP. Again, the United States is placed at the centre of the analysis, but in this case because of data availability. These data on bilateral asset holdings come from the US Treasury International Capital System (TIC) database. No equivalently long historical data of bilateral asset holdings is available for Western Europe (or, for that matter, anywhere else) – although more recently the International Monetary Fund's (IMF) Coordinated Portfolio Investment Survey provides data across a wider set of countries but with more limited coverage (e.g. official holdings are not included). We start the heat maps in 1994, the earliest date for which reasonably generalised data are available, and report also for 2001, 2007 (the eve of the crisis), and 2009.
As can be seen from Figure A5, US holdings of foreign bonds has risen over time, with this increase focused on Western Europe or, more accurately, the financial centres of the United Kingdom, the Netherlands, and, more recently, Ireland. A similar deepening of financial ties can be seen over time in foreign holdings of US bonds, but this is geographically much more generalised, encompassing major emerging market holders of international reserves such as China, Russia, Brazil and Middle East oil exporters, as well as Western European financial centres (Figure A6). Indeed, it is the emerging markets that are often major net lenders to the United States (Figure A7).
Importantly, however, holdings of US assets by Western European financial centres were much more focused on private bonds than were those of the rest of the world. The TIC data allow a further division between bilateral holdings of US government bonds, agencies (essentially, holdings of the quasi-public bonds of Freddie Mac and Fannie Mae, which were often assumed to contain an implicit government guarantee), and private bonds. Figure A8 shows the evolution of foreign holdings of corporate bonds using the same format as that for overall bonds shown in Figure A6. The unique dynamic evolution of the link between the United States and financial centres in Western Europe is now clear; this is the region of the world that developed deep holdings of a wide variety of US bonds, rather than simply buying Treasuries as reserve managers looked for a store of value.
Bilateral equity holdings were also much deeper between the United States and Western Europe. Figures A9 and A10 show the evolution of cross-border holdings of US and foreign equities, again from the TIC database, in the same format as the previous four figures. Again, Western European financial centres stand out.
We now turn to another aspect of financial linkages, namely cross-border asset holdings across banks. These data come from the Bank for International Settlements (BIS), and are only available from 1999 and even then the coverage is limited. Therefore, Figures A11–A13 show the evolution of these ties only for 1999, 2007 (pre-crisis), 2008 and 2009. The inclusion of 2008 and 2009 is because there is an important break in the series for US banking claims on other countries at the end of 2008. Prior to this date, only US commercial banks were included in the survey. After this date, US investment banks were included. This is important as US investment banks (which were confusingly counted as non-banks for regulatory purposes and were funding exclusively in wholesale markets) became an increasingly important force in the US banking system. Assets of broker-dealers (a good approximation of US investment banks available in the US Flow of Funds Accounts database) rose over time from less than 3 per cent of commercial bank assets in 1980 to around 30 per cent in 2007, on the eve of the global financial crisis. It then halved after the collapse of Lehman Brothers to 15 per cent currently as wholesale funding came under pressure.
Starting with US claims on foreign banking systems, the story coming from Figure A11 is one of close initial links with Western European financial centres that grew over time, given a further boost by the addition of US investment banks into the data in 2009. Outside of North America and a few small countries with particular links to the United States, this is a Western European trend, not a global one. Turning to foreign banking systems' claims on US banks (Figure A12), Western Europe again stands out, but in this case the story is more generalised. These US claims had always been relatively large – particularly for UK banks – but increased significantly over time and faster than those of other banking systems that had strong links, such as that of Canada. Hence, the boom of the 2000s amplified an existing close link.[2] What is also striking, however, is the lopsided nature of the ties. Western European banks are much more involved in the US banking system than US banks are in the Western European one (a feature that is also true of Canada and Japan) (Figure A13).
In addition, the nature of these links is quite different from those of other banking systems (see also Bhatia (2011)). As can be seen in Figure 1, the current heavy involvement of the UK, Swiss, German and Irish banks in the United States reflects ownership of US investment banking operations. For Canada and Japan, by contrast, the links are mainly from commercial banking (this is also true for France and the Netherlands, but here there is a catch as the investment banking operations of these banks are run out of London, rather than New York). Relevant data shows that branches of commercial banks are widely spread across the United States, while investment banks generally have a single office in New York, Connecticut, or (for regulatory reasons) Utah.
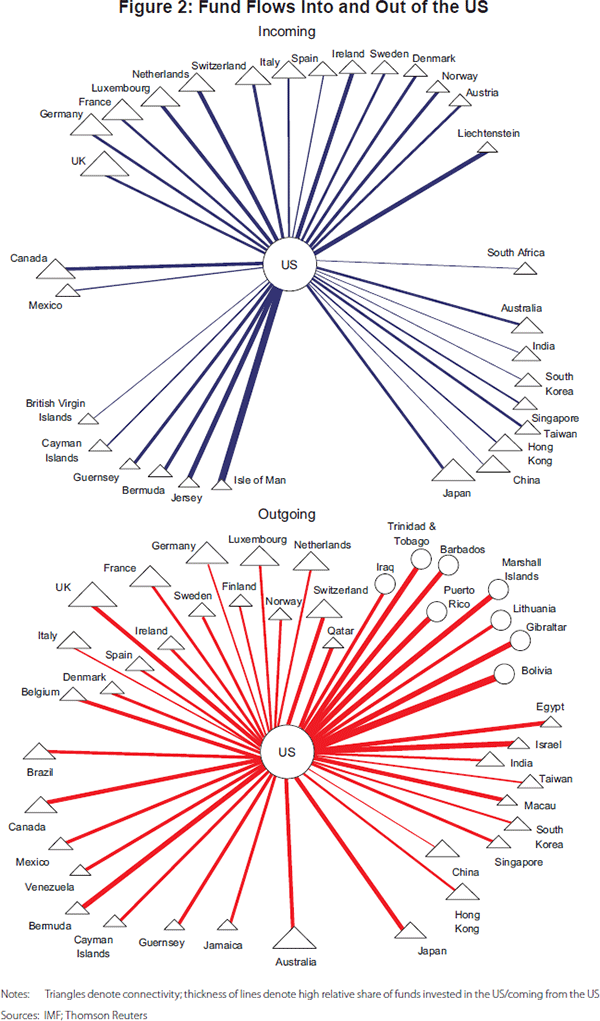
Finally, Figure 2 shows the importance of US (often short-term) liquidity provided by non-banks for Western Europe (see also IMF (2010)). It shows flows of global funds (investment funds, pension funds, money market mutual funds, etc) in and out of the United States. As can be seen, major flows go to Western European onshore financial centres, such as the United Kingdom and Switzerland, and offshore centres, such as Luxembourg, where the complex plumbing of modern financial engineering is accomplished.
Putting these data from a variety of sources together shows a Western European banking system that has steadily become more dependent on US dollar wholesale funding. This growing dependence comes out in different ways in the three sets of data. Most obviously, the BIS banking data illustrate increasing US asset holdings over time in a way that is significantly different from other regions. Microeconomic bank data show that this involves major investment banking operations in Northern Europe, which then act (together with US-owned investment banks and money market mutual funds) as a conduit for US dollar wholesale funding to the rest of the region. The TIC data show that this development was accompanied by increasing commingling of private sector bonds and assets that are needed for short-term funding operations such as repo operations. Finally, the funds data underline the importance of flows of US dollar liquidity in and out of European onshore and offshore financial centres, confirming the existence of sophisticated, modern funding techniques across the North Atlantic.
The reason that North Atlantic financial links evolved in this unique manner reflects the confluence of three underlying forces. On the North American side of the equation was the global dominance of US financial markets. On the Western European side was the push for an integrated financial system combined with the introduction of the euro. Finally, financial arbitrage within and across these two regions helps explain how these developments became as commingled as they did. The result was a North Atlantic financial system that functioned smoothly through the boom of the early 2000s, but generated massive spillovers to European banks and – in part via this mechanism – to the rest of the world over the crisis as counterparty risk ended the availability of ready US dollar wholesale funding.
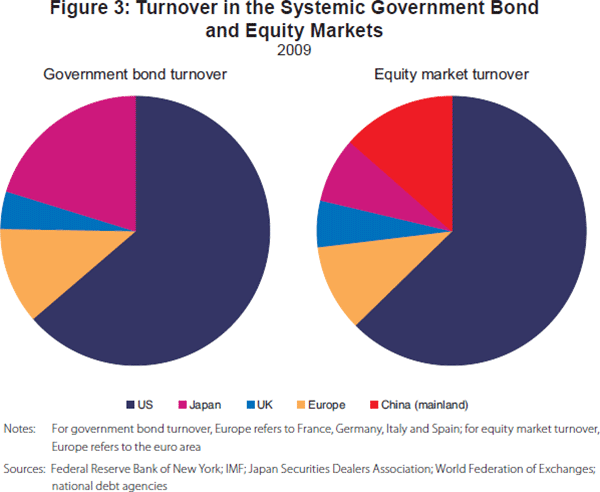
The dominance of US markets is the better understood part of the equation. That US markets are globally dominant is clear from the bellwether status of the benchmarks – the yield on the 10-year Treasury note and the price of the S&P 500 stock index. For example, European bond and stock markets typically jump when US ones open. At first glance this is slightly surprising, as the value of US and European bond and equity markets are quite similar. The superior information content of the US market, however, comes out in turnover and prices. As can be seen in Figure 3, US bond and equity markets have many times the turnover of any European market – including that of the UK. This is reflected in the more sophisticated market structure; lower transaction costs, larger derivatives markets and, above all, greater analysis and research. As to price information, several studies have found that European markets respond to US data releases much more than vice versa.[3] Similarly, vector autoregressions (VARs) using weekly prices that endogenously measure contemporaneous causation across international markets find that US bond yields and equity prices drive UK and euro area equivalents much more than the other way round (Neely 2010; Bui 2011; Yue and Shen 2011).
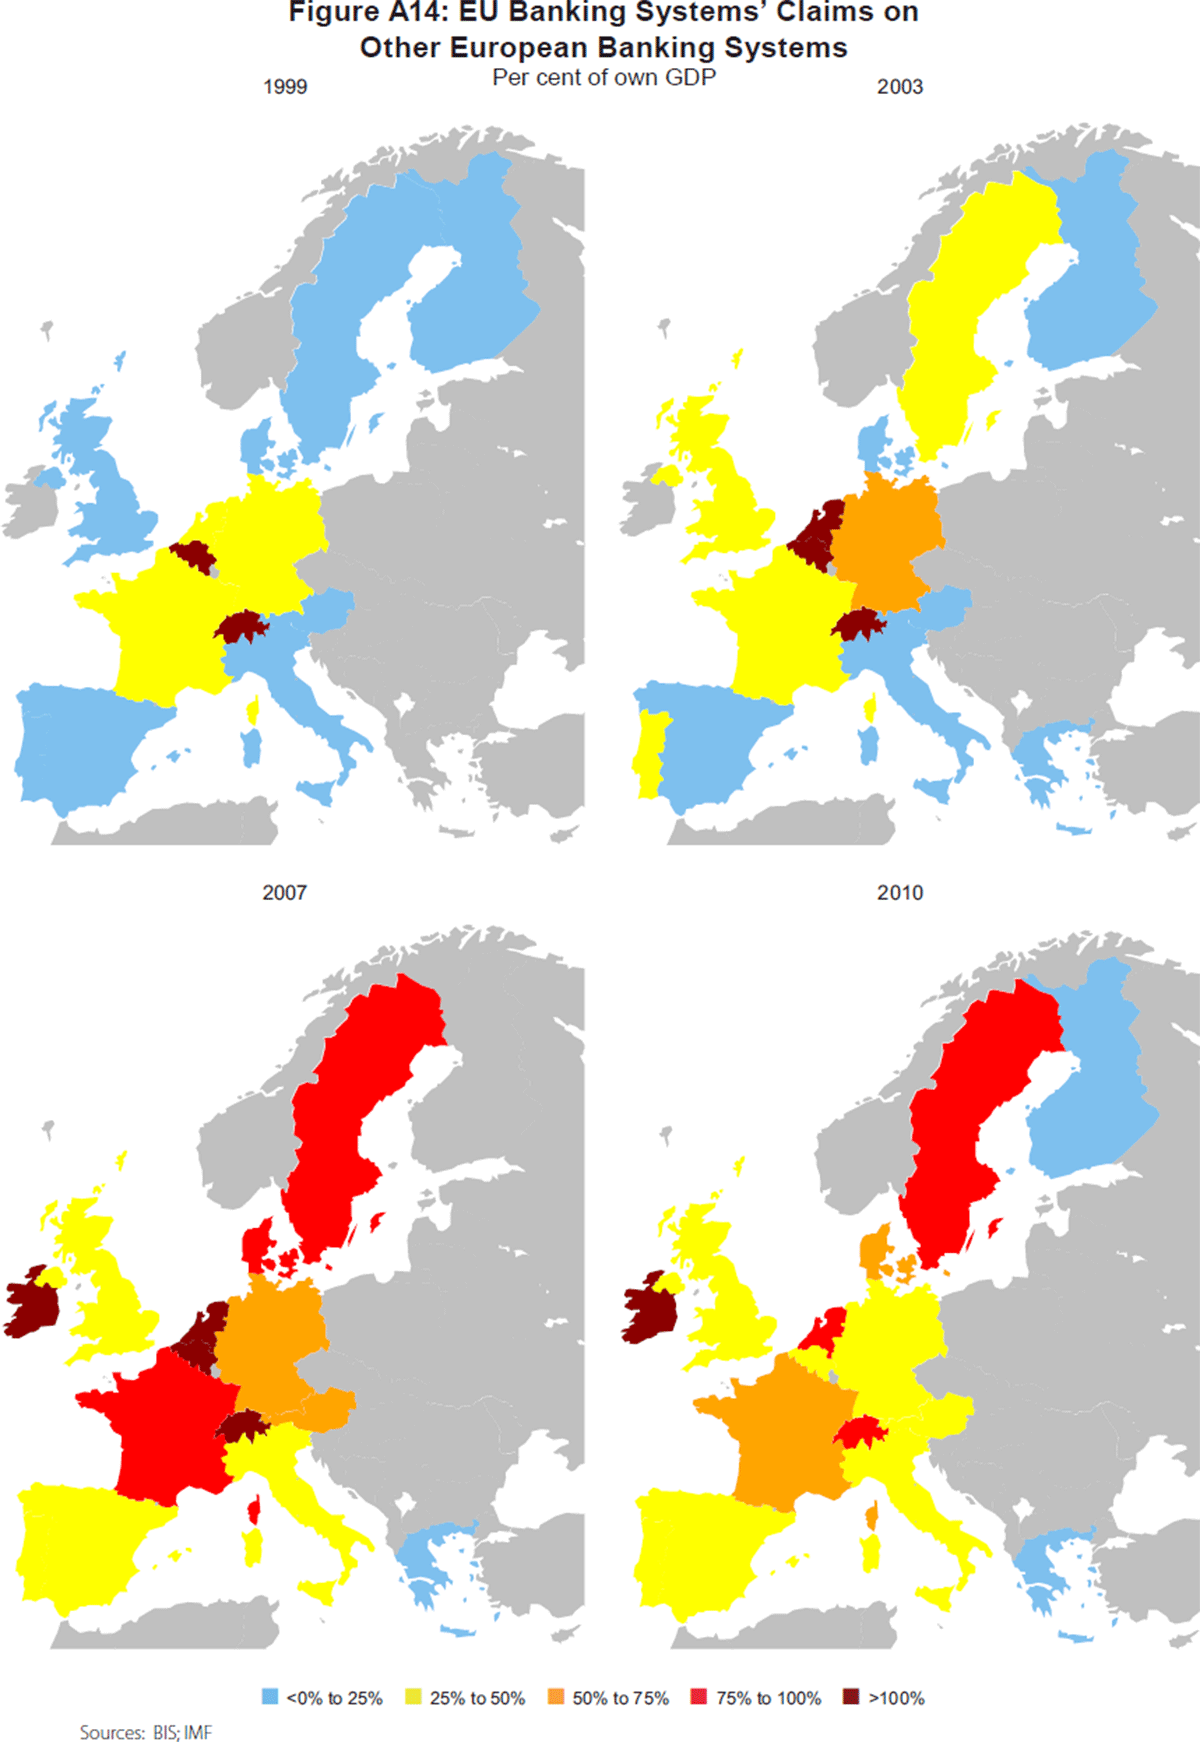
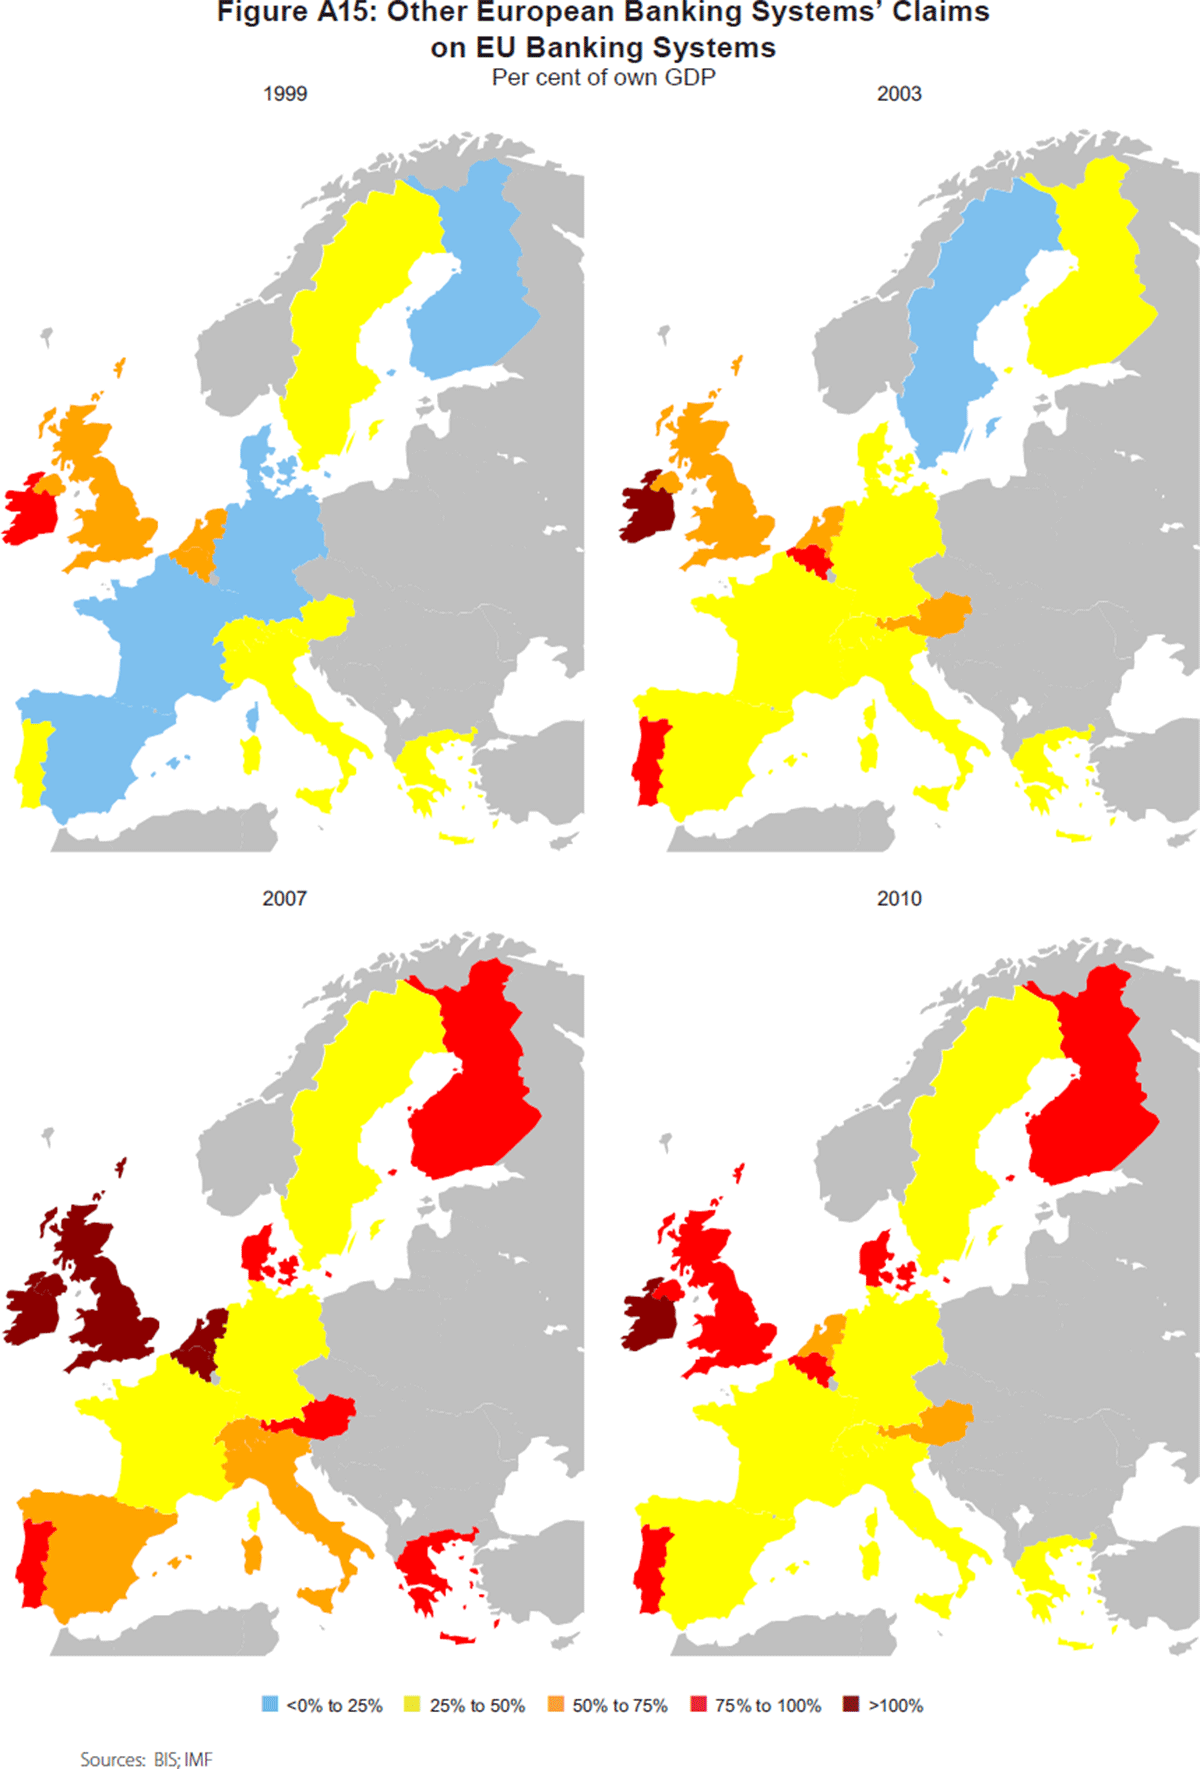
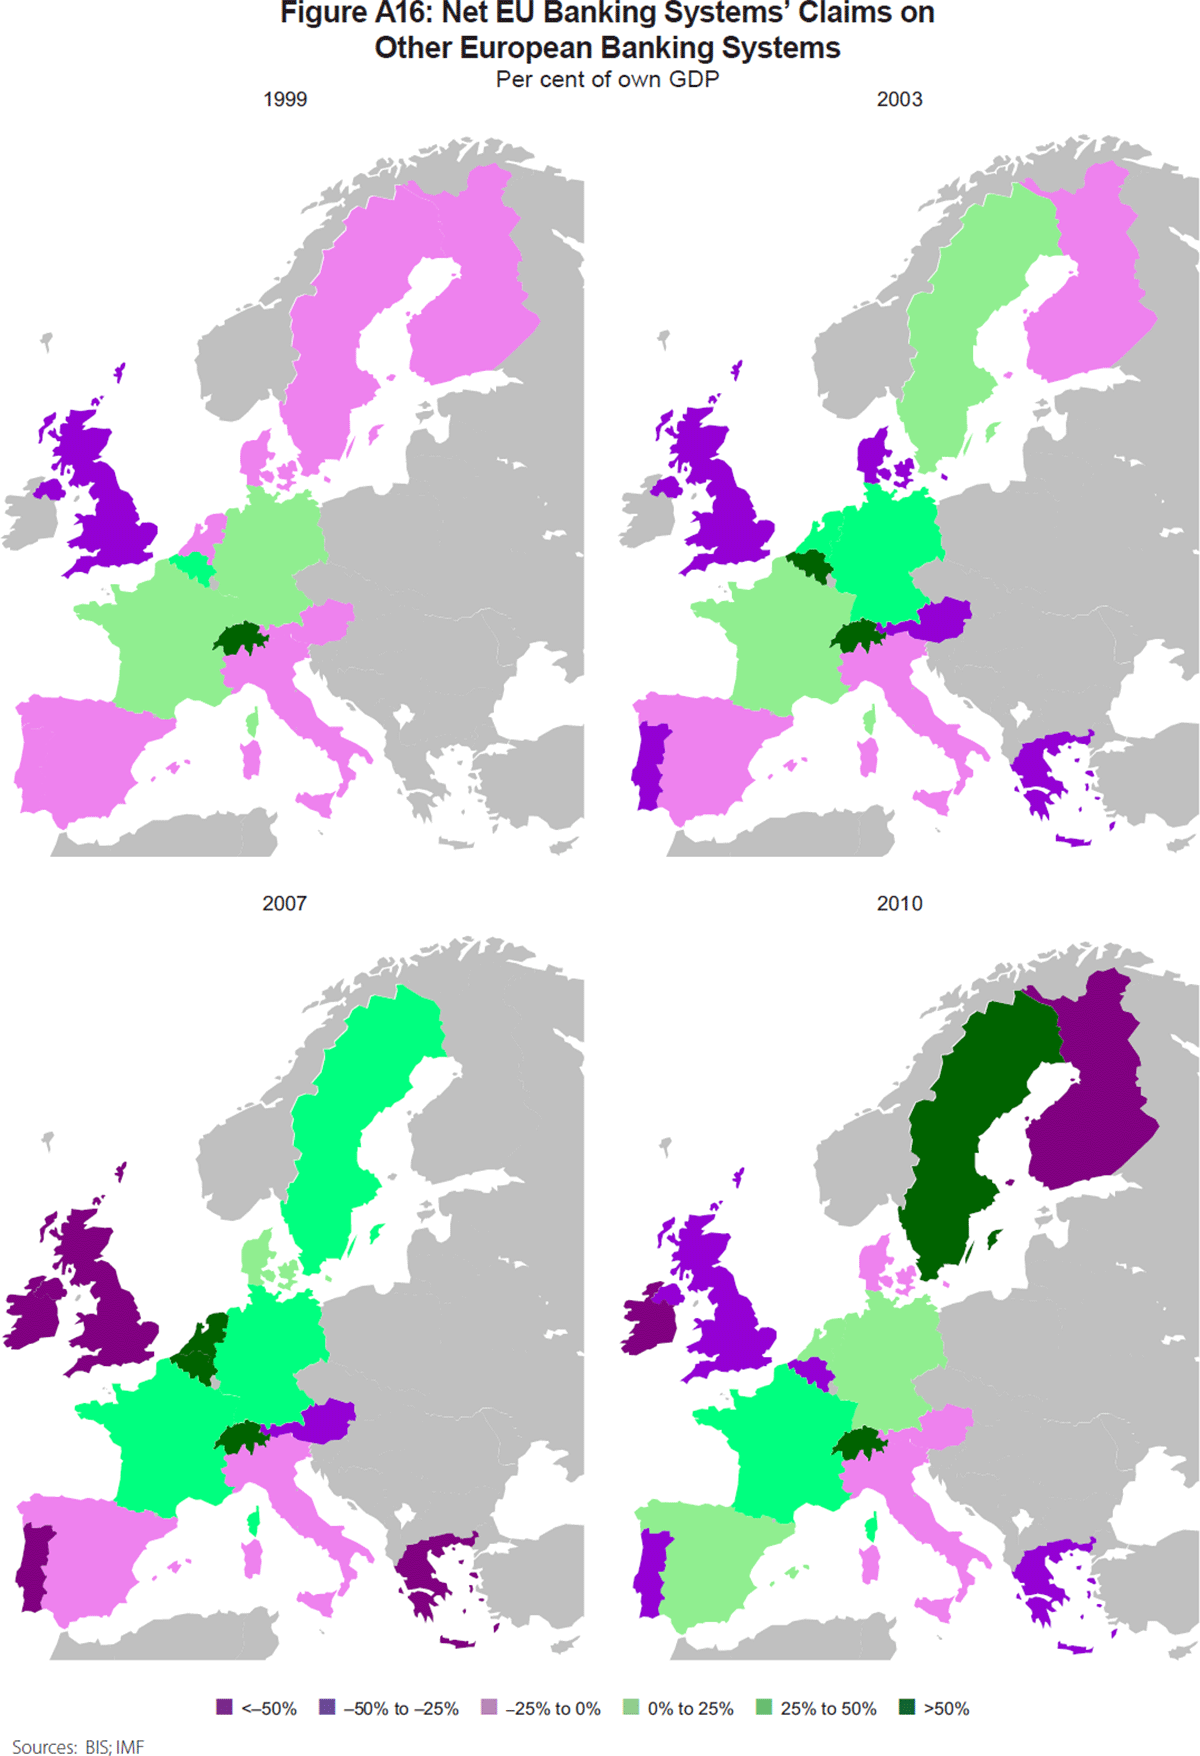
The push for a single European financial market drove an increase in competition across European Union banks that led to an aggressive search for profits from balance sheet expansion (see Dermine (2003)). While the US banking system had always been highly dynamic and competitive, the splintered European market was traditionally sleepy and overbanked. In 1989, however, the European Commission enacted the Second Banking Directive which allowed European banks to establish branches in other EU member countries without further authorisation – later extended in 1992 to members of the European Free Trade Association (EFTA) (except Switzerland). The implications of this directive for EU-wide bank competition were supported by the adoption in 1999 of the single currency in the euro area. In the financial boom of the 2000s, with cross-border bank takeovers still difficult (reflecting barriers as a result of national regulations), banks rapidly expanded their balance sheets and directly expanded into other countries, exacerbating existing overcapacity. This process is vividly illustrated in Figures A14–A16, which show BIS data on cross-border bank presence for 14 EU countries for the years 1999, 2003, 2007 (the eve of the crisis) and 2010: into other European economies (Figure A14); from other European countries (Figure A15); and net positions (Figure A16). Note that this data encompasses several countries outside of the euro area but in the passporting system, including the United Kingdom and Sweden, suggesting the trend was not driven solely by the single currency, while there was little increase in intermingling of the Swiss banking system (also shown, and which was outside of the passporting system) with EU members.
The generalised expansion in cross-European banking is illustrated in Figure A14, which shows an expansion by home EU banks into other EU countries between 1999 and 2007, with only a modest subsequent reversal largely in the Benelux countries (as local banks were sold to foreign entities). Interestingly, the flip side of the coin (Figure A15) shows that European banks mainly expanded into fast-growing periphery regions (including Scandinavia) between 1999 and 2007, followed by some pull-out from southern Europe between 2007 and 2010. This dynamic was supported in some cases (e.g. Ireland, the United Kingdom and Iceland) by a conscious decision to adopt ‘light touch’ regulation that limited prudential supervision of banks, that – together with low global interest rates – helped set off unsustainable foreign acquisitions and domestic housing booms. As the net positions (Figure A16) make clear, the overall effect was to transfer funds from the EU core (France, Benelux, Germany, plus Sweden) to the EU periphery through 2007 with a modest pull-back (largely in Germany and the Benelux) subsequently.
Finally, different approaches to global bank regulations across the North Atlantic led to divergent paths to higher leverage that helped drive financial interconnectedness between the United States and Western Europe. In the United States, the authorities required banks to maintain a simple leverage ratio as well as a risk-weighted one. As a result, US banks expanded leverage by placing assets in securitised pools and then selling them. By moving these assets off their balance sheet, this allowed them to conserve capital. In Europe, however, only a risk-weighted capital ratio was used. Generous risk weights produced an incentive to buy highly rated bonds – a triple-A rated bond with a 10 per cent risk weight required only 0.8 per cent capital (the basic 8 per cent ratio times the risk weight). As a result, European banks were major buyers of highly rated US securitised assets. Highly rated US assets played a dual role, both supporting profits through returns and providing collateral that could be easily used to raise US dollar wholesale funding in repo markets.
The outcome was a bank-dominated Western European financial system that was structurally dependent on US dollar wholesale funds, much of it provided by loosely supervised US non-banks (including investment banks). When the unexpected bankruptcy of Lehman Brothers in late 2008 led to severe problems in US wholesale markets, this instability was immediately transferred to Western Europe.
3. Empirical Estimates of North Atlantic Growth Spillovers
3.1 Time series evidence
Having mapped out trade and financial linkages between the North Atlantic economies over time, this section directly estimates growth spillovers using an innovative time series technique based on identification via heteroskedasticity. This is an old form of identification revived by Rigobon (2003) and extended by Bayoumi and Bui (2010) to look at growth spillovers. The technique works as follows. Let us suppose that there is a period of time over which underlying relationships are stable, but where regimes with differing ratios of shocks can be identified. In the case of growth spillovers across the major advanced economies, Bayoumi and Bui (2010) use the period since 1970 as the sample, and the break in regime is the onset of the ‘great moderation’ that (to varying degrees) lowered growth volatility across almost all economies and started sometime in the 1980s. Causation can then be identified within a VAR framework by relating changes in relative variance across countries to changes in correlations of shocks. Suppose, for example, that over the great moderation period the volatility of US growth relative to that of UK growth rises and that, at the same time, the correlation of US and UK growth rises. Then the methodology would identify causation as generally running from US growth to UK growth.
An innovation in Bayoumi and Bui (2010) is to also realise that by varying the (uncertain) date at which the great moderation started, it is possible to not only estimate the direction of contemporaneous causation but also the uncertainty around these estimated coefficients. In other words, in addition to the usual uncertainty in impulse response functions from VARs caused by parameter uncertainty, one can overlay uncertainty over the parameters of the matrix defining the correlation of contemporaneous growth shocks across countries (the so-called A matrix that is generally identified by assumption using a Choleski decomposition rather than being estimated). This ‘bootstrap’ technique works as Rigobon (2003) showed that the estimation technique was consistent even if the choice of the break date between the two samples is incorrect. Hence, Bayoumi and Bui (2010) are able to calculate uncertainty around the impulse responses due to uncertainty about the A matrix, as well as the ‘usual’ uncertainty as a result of potential volatility on the coefficients of the VAR.
Results for a VAR using quarterly growth for the euro area, Japan, the United States, the United Kingdom and an amalgam of other countries identified as the rest of the world, from 1970 to the end of 2007, are reported in Figure 4. Each panel in the figure shows the impact of a shock in one area on itself and other regions – for example, the centre-left panel shows the estimated effect of a US shock on each of the members of the VAR over 8 quarters.
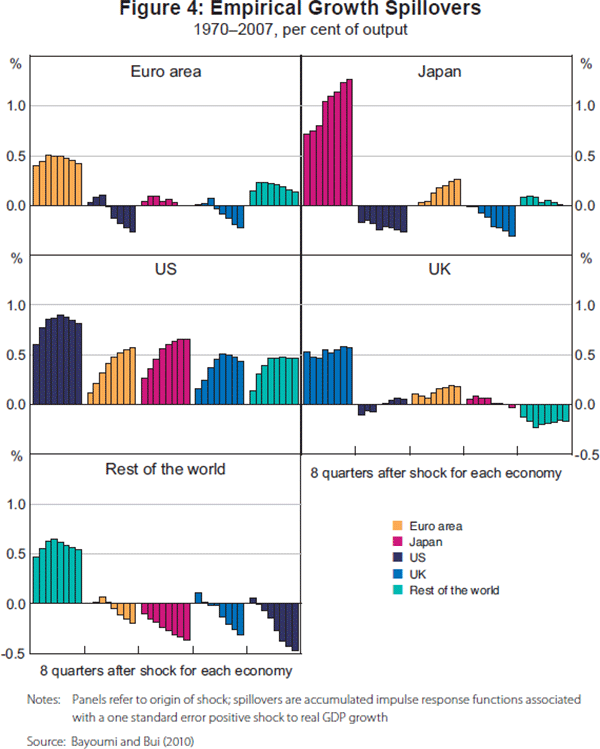
The results suggest that growth spillovers across the North Atlantic are highly asymmetric. Spillovers from US growth shocks on foreign real GDP rise gradually over time, to between half and three-quarters of the relevant US value after 8 quarters, and are generally significant. More specifically, a shock that increases US real GDP by 0.8 per cent over two years increases euro area and UK real GDP by 0.6 per cent and 0.4 per cent, respectively. However, the opposite effects from the euro area to the United States are much smaller and insignificant. In particular, despite its economic size, euro area spillovers to the United States rise modestly over the first few quarters and then fall to close to zero. In addition, within Europe the (marginally significant) spillovers from the United Kingdom to the much larger euro area economy are estimated to be at least as large as those in the opposite direction.
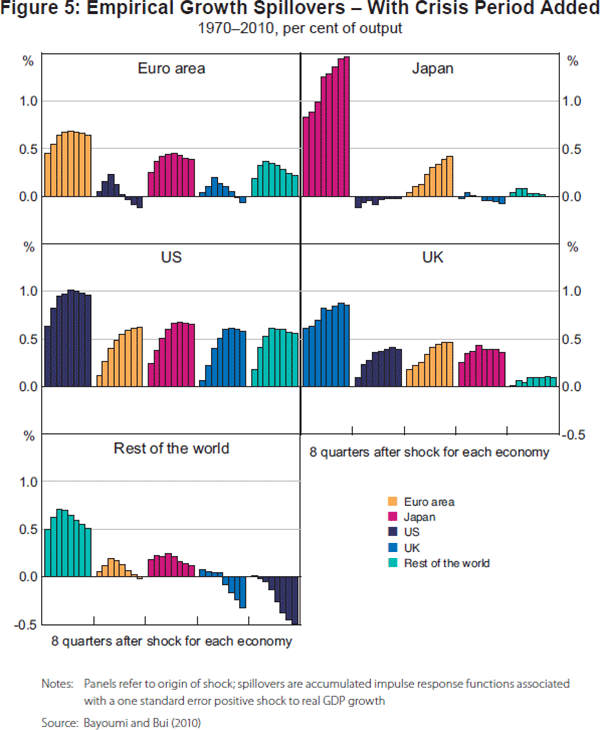
The earlier discussion provides a plausible explanation for the strong asymmetry seen in growth spillovers between the United States and European economies, and within Europe, between the United Kingdom and the euro area. If financial relationships are more important for growth spillovers than trade ones, then the large US and UK spillovers make sense. Bayoumi and Bui (2010) provide some suggestive evidence for such an explanation. Another approach is to examine the impact of the recent financial crisis. Since the shock from the United States to Europe, and from the United Kingdom to the euro area, was clearly channelled through financial market relationships, one would expect the inclusion of the financial crisis in the estimation to increase spillovers.
This intuition is supported by the results from VARs including the post-2008 crisis period and reported in Figure 5. The results in Figure 5 come from an estimation in which the crisis period is simply included in the VAR as if it were a continuation of the pre-great moderation period of instability (see Bayoumi and Bui (2010) for details). As can be seen by comparing these estimates with those in Figure 4, the crisis boosts estimates of both US and, in particular, UK spillovers. The disadvantage with this approach, however, is that it is difficult to get a clean estimate of the spillovers during the crisis as this part of the sample is mixed with data from the 1970s and 1980s. Macroeconomic models provide an alternative approach.
3.2 Macroeconomic model evidence
An alternative way of estimating growth spillovers is to use results from an empirically estimated macroeconomic model. While the structural VAR discussed above is closer to the data, macroeconomic models allow for more precision on the sources and mechanisms through which these spillovers occur. This section uses the macroeconomic model described in Vitek (2010, 2011c). This model was chosen as it covers a wide range of economies (the G-20) and has sufficient financial market detail to allow financial spillovers to be modelled realistically. More precisely, the model includes bond yields, equity prices and a spread between government and private sector short-term interest rates for each economy, thereby allowing realistic cross-country correlations across bond, equity and wholesale funding market risk premiums to be imposed.[4] A further advantage of the model is that it is linear, so that simulations can be layered on one another to provide insights as to sources of spillovers.
Results again find that US spillovers are much larger than Western European ones and come largely through financial market channels. The top panels of Figure 6 report results from two simulations layered on top of one another for a typical growth shock (more precisely, an equal weighting of an aggregate demand, aggregate supply, term risk premium and equity risk premium shock). The blue columns represent a pure simulation in which the model is allowed to run without imposing additional financial market correlations. This results in small and relatively similar growth spillovers across the major countries coming mainly through trade. Hence, for example, a 1 per cent increase in US output raises demand for exports from other countries. The impact is small as bilateral trade is also small – exports to the United States represent just 2 per cent of combined euro area and UK GDP. Crucially, there are few financial market spillovers. This is because domestic bond yields depend only on the expected path of domestic short-term policy interest rates, themselves driven by a Taylor rule. As growth spillovers are small, there is little knock-on to monetary policy rates and bond yields. It is worth stressing that this is a typical result from conventional macroeconomic models and is not a peculiarity of the chosen model.
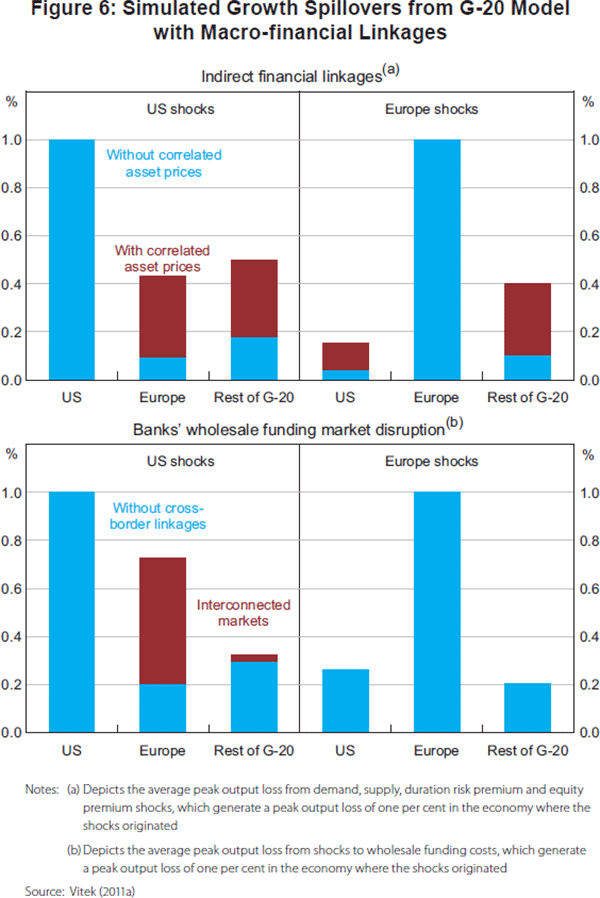
Adding empirically estimated correlations of international risk premiums produces larger and more asymmetric growth spillovers. The red columns show the results of a simulation in which bond and equity risk premiums are correlated using the empirical estimates discussed earlier and reported in Bayoumi and Bui (2011). Focusing on the North Atlantic economies, a 1 percentage point increase in US bond yields is assumed to create around a 0.4 percentage point increase in euro area and UK yields, while the feedback in the other direction is small. For equity prices, the impact is around a 0.6 per cent increase to a 1 per cent increase in US equity prices. This results in much larger US growth spillovers. A 1 per cent increase in US output now generates a 0.4 per cent increase in European output, while the reverse impact remains similar to the initial simulation. Further investigation reveals that the main spillover channel comes through bond yields (Vitek 2011a). These responses, which can be regarded as estimates of spillovers for a typical shock, are much closer to the baseline empirical estimates reported in Section 3.1 and support the hypothesis that financial market linkages explain the size and asymmetric effect of US growth spillovers.
Disruptions to bank wholesale funding markets are another powerful source of growth spillovers. The bottom panels of Figure 6 show the results of a shock to US and European wholesale funding costs. Again, there are two simulations layered on top of one another. In the basic regression, it is assumed that wholesale funding is limited to local markets and that spillovers occur only through bank loans across regions. As can be seen, the impact of a US and a European wholesale funding shock is similar and (relatively) limited, with a multiplier of around one-quarter. In the second simulation, however, it is assumed that half of all European wholesale funding comes from US markets, and hence that a 1 percentage point increase in US wholesale funding costs leads to a 0.5 percentage point increase in European funding costs. Nobody knows the true extent of marginal dollar funding of European banks, but one-half is not an unreasonable estimate. This enhances the growth spillovers from US wholesale funding costs from one-quarter to more like three-quarters – considerably higher than the spillovers caused by the financial market correlations. This illustrates the important role of US–European bank links – in particular, the heavy dependence of European banks on US dollar wholesale funding – in propagating global shocks.
4. Conclusions
This paper has examined interrelationships across the North Atlantic economy from three perspectives. Historical data reveal a strong dichotomy between trade and financial market developments. Trade links, upon which most macroeconomists focus, were in relative stasis, the main sources of dynamism being either within these economies (NAFTA and the European single market) or with other parts of the world (notably Asia). By contrast, the North Atlantic furnished a uniquely close relationship across financial institutions, as a combination of dominant US financial markets, European competition policy and differences in financial regulation made the European banking system heavily dependent on US dollar wholesale funding. Empirical estimates and macroeconomic model simulations indicate that growth spillovers predominantly flow eastward across the North Atlantic. The bellwether nature of US financial markets creates uniquely large spillovers to the rest of the world even in normal times, and these spillovers are only enhanced if disruptions to bank wholesale funding markets are added – as occurred during the recent global crisis.
Looking forward, three things stand out from this analysis. The first is the important role played by differences between US and European financial regulation, and policies to promote a single market within Europe, in encouraging close financial market ties across the North Atlantic. This lesson should not be lost as global and European financial regulations are reformed. Second, the sheer size of US growth spillovers mean that the rest of the world have a legitimate interest in US policy decisions, underlining the importance of international processes promoting dialogue and co-operation across governments. Third, the apparent importance of financial market ties in generating international growth spillovers emphasises the importance of research to understand high correlations of prices across markets. The days of focusing on trade as the major source of international spillovers should be over.
One final thought is that the dominant status of US financial markets is not immutable. The status of the US dollar as the main global store of value rests on many factors, including stable US macroeconomic conditions. After the crisis, others may increasingly question whether this will continue. While it will take time for the underlying market infrastructure to be created, the fulcrum of financial market activity – and associated spillovers – may gradually start to move, with interesting implications for the global business cycle.
Appendix A
Footnotes
The views expressed in this paper are those of the authors and do not necessarily reflect those of the International Monetary Fund (IMF) or IMF policy. Many thanks to Francis Vitek for helpful comments and support, which hugely improved the paper and to Kathryn Dominguez (our discussant) and other members of the Conference for key insights.[*]
Due to data availability, we chose the Group of Twenty and some major emerging market countries for the years 1995, 2000, 2007 and 2009. The full list of countries is available upon request from the authors.[1]
Some discussions of US–Western European bank ties emphasise the uniqueness of the 2000s boom (McGuire and von Peter 2009), including the purchase of US securitised bonds by Western European banks. While agreeing that this development was important, a longer perspective suggests it was more evolution than revolution. See also Alessandri and Haldane (2009).[2]
See, for example, Ehrmann, Fratzscher and Rigobon (2011) and references cited therein.[3]
For other applications of this model, see Vitek (2011a, 2011b).[4]
References
Alessandri P and AG Haldane (2009), ‘Banking on the State’, Presentation delivered at the Federal Reserve Bank of Chicago Twelfth Annual International Conference ‘The International Financial Crisis: Have the Rules of Finance Changed?’, Chicago, 24–25 September.
Bayoumi T and T Bui (2010), ‘Deconstructing the International Business Cycle: Why Does a U.S. Sneeze Give the Rest of the World a Cold?’, IMF Working Paper No WP/10/239.
Bayoumi T and T Bui (2011), ‘Unforeseen Events Wait Lurking: Estimating Policy Spillovers from U.S. to Foreign Asset Prices’, IMF Working Paper No WP/11/183.
Bhatia A (2011), ‘U.S. Financial Spillovers: Cross Border Linkages’, in ‘The United States Spillover Report – 2011 Article IV Consultation: Spillover Report – Selected Issues Paper’, IMF Country Report No 11/203, pp 22–26.
Bui T (2011), ‘US Financial Spillovers: Typical Advanced Country Responses’, in ‘The United States Spillover Report – 2011 Article IV Consultation: Spillover Report – Selected Issues Paper’, IMF Country Report No 11/203, pp 3–4.
Dermine J (2003), ‘Banking in Europe: Past, Present and Future,’ in V Gaspar, P Hartmann and O Sleijpen (eds), The Transformation of the European Financial System, Second ECB Central Banking Conference, European Central Bank, Frankfurt am Main, pp 31–95.
Ehrmann M, M Fratzscher and R Rigobon (2011), ‘Stocks, Bonds, Money Markets and Exchange Rates: Measuring International Financial Transmission’, Journal of Applied Econometrics, 26(6), pp 948–974.
IMF (International Monetary Fund) (2010), ‘Understanding Financial Interconnectedness’, IMF Policy Paper. Available at <http://www.imf.org/external/np/pp/eng/2010/100410.pdf>.
IMF (2011), ‘The United States Spillover Report – 2011 Article IV Consultation’, IMF Country Report No 11/203.
McGuire P and G von Peter (2009), ‘The US Dollar Shortage in Global Banking’, BIS Quarterly Review, March, pp 47–63.
Neely CJ (2010), ‘The Large-Scale Asset Purchases Had Large International Effects’, Federal Reserve Bank of St. Louis Working Paper 2010-018C. Available at <http://research.stlouisfed.org/wp/more/2010-018/>.
Riad N and C Saborowski (2011), ‘U.S. Trade Spillovers: Supply Chain Effects,’ in ‘The United States Spillover Report – 2011 Article IV Consultation: Spillover Report – Selected Issues Paper’, IMF Country Report No 11/203, pp 17–19.
Rigobon R (2003), ‘Identification through Heteroskedasticity’, The Review of Economics and Statistics, 85(4), pp 777–792.
Vidon E (2011), ‘U.S. Trade Spillovers: Typical Responses to U.S. Activity’, in ‘The United States Spillover Report – 2011 Article IV Consultation: Spillover Report – Selected Issues Paper’, IMF Country Report No 11/203, pp 20–21.
Vitek F (2010), ‘Monetary Policy Analysis and Forecasting in the Group of Twenty: A Panel Unobserved Components Approach’, IMF Working Paper No 10/152.
Vitek F (2011a), ‘U.S. Growth Spillovers: Fiscal Policy’, in ‘The United States Spillover Report – 2011 Article IV Consultation: Spillover Report – Selected Issues Paper’, IMF Country Report No 11/203, pp 40–42.
Vitek F (2011b), ‘U.S. Growth Spillovers: Monetary Policy’, in ‘The United States Spillover Report – 2011 Article IV Consultation: Spillover Report – Selected Issues Paper’, IMF Country Report No 11/203, pp 31–33.
Vitek F (2011c), ‘U.S. Growth Spillovers: Typical Responses’, in ‘The United States Spillover Report – 2011 Article IV Consultation: Spillover Report – Selected Issues Paper’, IMF Country Report No 11/203, pp 14–16.
Yue V and L Shen (2011), ‘International Spillovers on Government Bond Yields: Are We All in the Same Boat?’, Federal Reserve Bank of New York Liberty Street Economics blog, 1 August.
