風蕭蕭_Frank
以文會友


拿最多的錢,修最差的路,加州到底在怎麽想?
為因應通膨,加州的汽油稅7月再漲3分,來到每加侖58分高位,繼續在全美領先。加州汽油稅之所以昂貴,是因為內含「養路費」;不過納稅人每年花大價錢養護的道路,卻連年被評為全美最爛。政府應該反思,為何在加州花錢,效用如此之低。
理財網站 MoneyGeek,每年會分析美國交通部數據,為全美50個州打分。2023年最新報告顯示,加州不出意外,再次被評為路況最糟糕(roughest roads)州。報告指出,加州約44%的道路處於「差」的狀態,比百分比排名第二的羅德島州(Rhode Island)多3個百分點。而且翻看該網站的報告曆史,「加州最近六、七年間的成績很穩定,不是倒數第一,就是倒數第二。
加州雖然成績不好,但從預算看得出來是有打算好好用功希望有所改善,起碼在花錢修路方麵,絕不含糊;投資到每哩路上的維護費用為23.16元,排名全美第10。而且在2017年推出的「道路修複與負責任法案」(SB1)幫助下,未來加州每年還會花更多的錢用於修路。
SB1法案規定,用於修複、改進和維護交通基礎設施的部分資金,將從燃油稅和車輛注冊費中支付。受此影響,加州的汽油稅連年上漲。法案施行的2017年,加州每加侖汽油稅約為30分;如今五年過去,汽油稅已近翻倍。
盡管用於修路的開銷已經不少,但工程建設谘詢公司NCE估算,若維持目前州政府的道路修複與養護預算,路麵狀況還會繼續惡化。想要將當前水準保持到2030年,每年需要多拿出約13億元;希望提升至「良好」級別,則需要每年增加約54億元。
想要增加修路預算,意味著更高的稅費。問題是,加州目前的稅費之重,已讓納稅人苦不堪言,想要再加稅,談何容易。而且加州政府用於修路的錢居全美第10多,卻仍修出全美排名第50的路;想要增加預算,政府更需要反思,錢花的沒效率的原因,或是應該要思考如何能根本性的解決路況問題。
國會眾議員Doug LaMalfa曾說過,無論是什麽項目,在加州都很難建成;受工會影響,這裏幹什麽似乎都比較貴。LaMalfa或許是礙於民選官員的身分沒有明說,但他已在暗示加州過於保護勞工的政治環境,可能已成為效率的阻礙,有人曾揶揄,同樣的工程,其他州勞工也許一天就能完成,加州的勞工恐怕得花兩天。
花錢效用的不同,自然會讓人產生加州經常「花大錢辦小事」的感覺,而且在工會的影響下,雇主往往需要支付更高的工資,才能做成相同的事。
Road Conditions & Spending by State: Does More Money Mean Better Roads?
By Deb Gordon | 4/2/2023
https://www.moneygeek.com/living/states-worst-road-infrastructure/
State and local governments spend billions each year on road maintenance and operations, but does it amount to better roads for taxpayers?
MoneyGeek analyzed data from the U.S. Department of Transportation and the U.S. Census Bureau to learn more about America’s urban road infrastructure, find the states with the best and worst road quality and determine if more state spending translated to better roads.
Our findings suggest that taxpayers are not necessarily getting their money’s worth. At best, they are getting just enough road investment to maintain the current condition of roads, but not enough to improve them.
KEY FINDINGS:
- About 1 in 10 U.S. roads are in poor condition, but urban roads are even worse: 1 in 5 are in poor condition.
- California and Rhode Island were the states ranked worst for road roughness, with 44% and 41% of roads in poor condition, respectively.
- New Hampshire and Alabama had the best roads in the U.S. and spent some of the lowest capital outlay per mile ($9.82 and $6.44, respectively).
- States generally spend in proportion to how much their roads are utilized, reflecting both the need to address wear and tear and how roads are funded — typically, via gas taxes.
- However, how much each state spends on roads has no correlation with road quality after adjusting for vehicle miles.
- MoneyGeek analyzed overall road quality and the investment levels per lane mile in every state and found that more spending on roads did not necessarily lead to better road quality.
Roughest Roads & Infrastructure Spending by State
MoneyGeek analyzed overall road quality and the investment levels per lane mile in every state and found that more spending on roads did not necessarily lead to better road quality.
The road roughness index is the weighted average value of the observed measurements of the international roughness index (IRI) for the state. The Federal Highway Administration indicates that an IRI measure of less than 95 indicates a road in good condition, between 95 and 170 is acceptable, and greater than 170 is poor condition.
For example, California's roughness index score of 160 means that the state's road conditions are borderline acceptable, on average. In reality, 44% of California’s roads are in poor condition, the most of any state in the U.S.
Relationship Between State Spending & Road Conditions
MoneyGeek’s analysis of all 50 states shows that states generally spend proportionately to the vehicle miles traveled; however, there are exceptions. New York and Pennsylvania both spend proportionately more than the vehicle miles traveled, and California spends proportionately less.
Regardless of how much money they spend on road conditions, states are using available funds to maintain — not fix or improve — crumbling roads.
After adjusting for vehicle miles, MoneyGeek found no correlation between spending and road conditions. If states were working to improve their roads, the worse the roads, the more the state would be spending (in order to fix them). Additionally, our analysis found that many of the most tax-friendly states in the U.S. had fairly good road quality. They are trying to keep roads in working order, just as states with higher taxes are.
Who Pays For Roads?
Three-quarters of spending to maintain and fix roads and highways comes from state and local governments. According to the Urban Institute, the average state spends nearly 8% of its budget on roads. The rate of investment has not changed much over time. In 1977, 8% of state and local budgets combined went toward roads and highways, compared with 6% in 2017. It's no wonder state highways are the deadliest type of road in the U.S., accounting for 33% of all traffic fatalities.
Through the Highway Trust Fund (HTF), the federal government provides grants to states to maintain and improve the Interstate Highway System. Funded by transportation-related taxes such as gasoline and diesel taxes, the HTF spends more than it raises in revenue. According to the Congressional Budget Office (CBO), the fund ran a $16 billion deficit in 2020. The CBO’s projections predict that the fund, which has relied on transfers from general tax funds since 2008, will be depleted by 2023.
Expert Panel: The Economic Impact of Road Improvements and Neglect
- How is highway improvement usually funded?
- What is the impact of investment in road improvement? What are the implications when states do not invest in such improvements?
- How do poor roads impact drivers?
- Are there broader impacts of poor roads on communities or local economies?
- Would COVID-19 Infrastructure spending be an effective economic stimulus?
- Is there anything you'd like to add about the relationship between the quality of roads, state budgets and state or local economic indicators?


Why Are Roads in Good Repair Important?
Quality roads and highways are essential to the broader U.S. economy. Most consumer goods travel along the nation’s highways, and investing in improving roads has historically boosted economic growth. Better roads mean lower costs to deliver goods due to lower maintenance and gas costs. The Infrastructure Investment and Jobs Act passed in late 2021 is expected to spur economic growth as funds are deployed on infrastructure projects including the repair of crumbling roads.
For the consumer, poor road conditions translate directly into higher car repair and maintenance costs. They may even have a harder time finding cheap car insurance due to increased claims. Drivers in states with rough road conditions that don't want to be left paying for damage due to potholes should purchase full coverage car insurance. Full coverage includes collision insurance which is the provision that insures damages to your car, unlike liability-only insurance which will only cover damages you owe to others in accidents where you are at fault. Full coverage car insurance can cost drivers hundreds more every year than liability-only, but there are affordable options and the coverage you get is worth it.
Methodology
MoneyGeek determined how states rank on the condition of their urban and suburban roads and their highway infrastructure spending by comparing the roughness measure of each state's urban and suburban highways and state and local (municipal and county) government expenditures on their highway system. We used the metrics below to establish final scores and rankings:
- Road Roughness Index: We developed a composite roughness score of all major urban roadways in each state by weighting each category of measured pavement roughness and aggregating this information across the entire state system.
- Percentage Poor vs. Good Condition: We designated each category of measured pavement roughness into larger groupings and compared the number of lane miles across the state by groupings of higher and lower pavement roughness.
- Capital Outlays per Lane Mile: This value is calculated as the total state expenditure on capital outlays for highways divided by the total lane miles in each state's functional road system.
- Total Highway Spend: This value is calculated as the total state expenditure on both capital outlays and other expenditures for highways.
About Deb Gordon

SOURCES
- Congressional Budget Office. "Budget and Economic Data." Accessed October 21, 2021.
- Urban Institute. "Highway and Road Expenditures." Accessed September 21, 2022.
- U.S. Census. "2020 State & Local Government Finance Historical Datasets and Tables." Accessed September 13, 2022.
- U.S. Department of Transportation. "Highway Statistics 2020 - Functional System Length - 2020." Accessed September 13, 2022.
- U.S. Department of Transportation. "Highway Statistics 2020 - Annual Vehicle Miles." Accessed September 13, 2022.
- U.S. Department of Transportation. "Highway Statistics 2020 - Functional System Lane-Length." Accessed September 13, 2022.
In Some States, Local Roads Are Deadlier Than Highways
Advertising & Editorial Disclosure
Quality Verified
There's a reason why parents talk about looking both ways before crossing the street, and driving instructors hammer home the importance of stopping at a stop sign: roads can be deadly.
While certain types of roads may seem more or less dangerous than others, this isn’t true everywhere. MoneyGeek analyzed the National Highway Traffic Safety Administrations Fatality Analysis Reporting System (FARS) data and found that, in some states, you’re far safer taking the highway than a local street.
Our analysis broke down the deadliest types of roads in the U.S. and the deadliest road type in each state. Here's what we found:
KEY FINDINGS:
- State highways are the deadliest type of road in the U.S., accounting for 1 in 3 crash fatalities.
- Pennsylvania has the country’s deadliest state highways, with 57% of crash fatalities occurring on this type of road.
- In nine states, driving on a local street is deadlier than taking the highway. In Arizona, the state with the deadliest local streets, half of all crash fatalities in the state happen on local roads.
- North Carolina experiences the highest fatality rate in the country on its section of the U.S. highway system, with 38% of all state crash deaths occurring on these roads.
- Minnesota is home to the deadliest county roads in the U.S.; there, 40% of all crash fatalities occur on this road type. Michigan is the next-deadliest (37% of all crash fatalities) state.
The Most Dangerous Types of Road in the U.S.
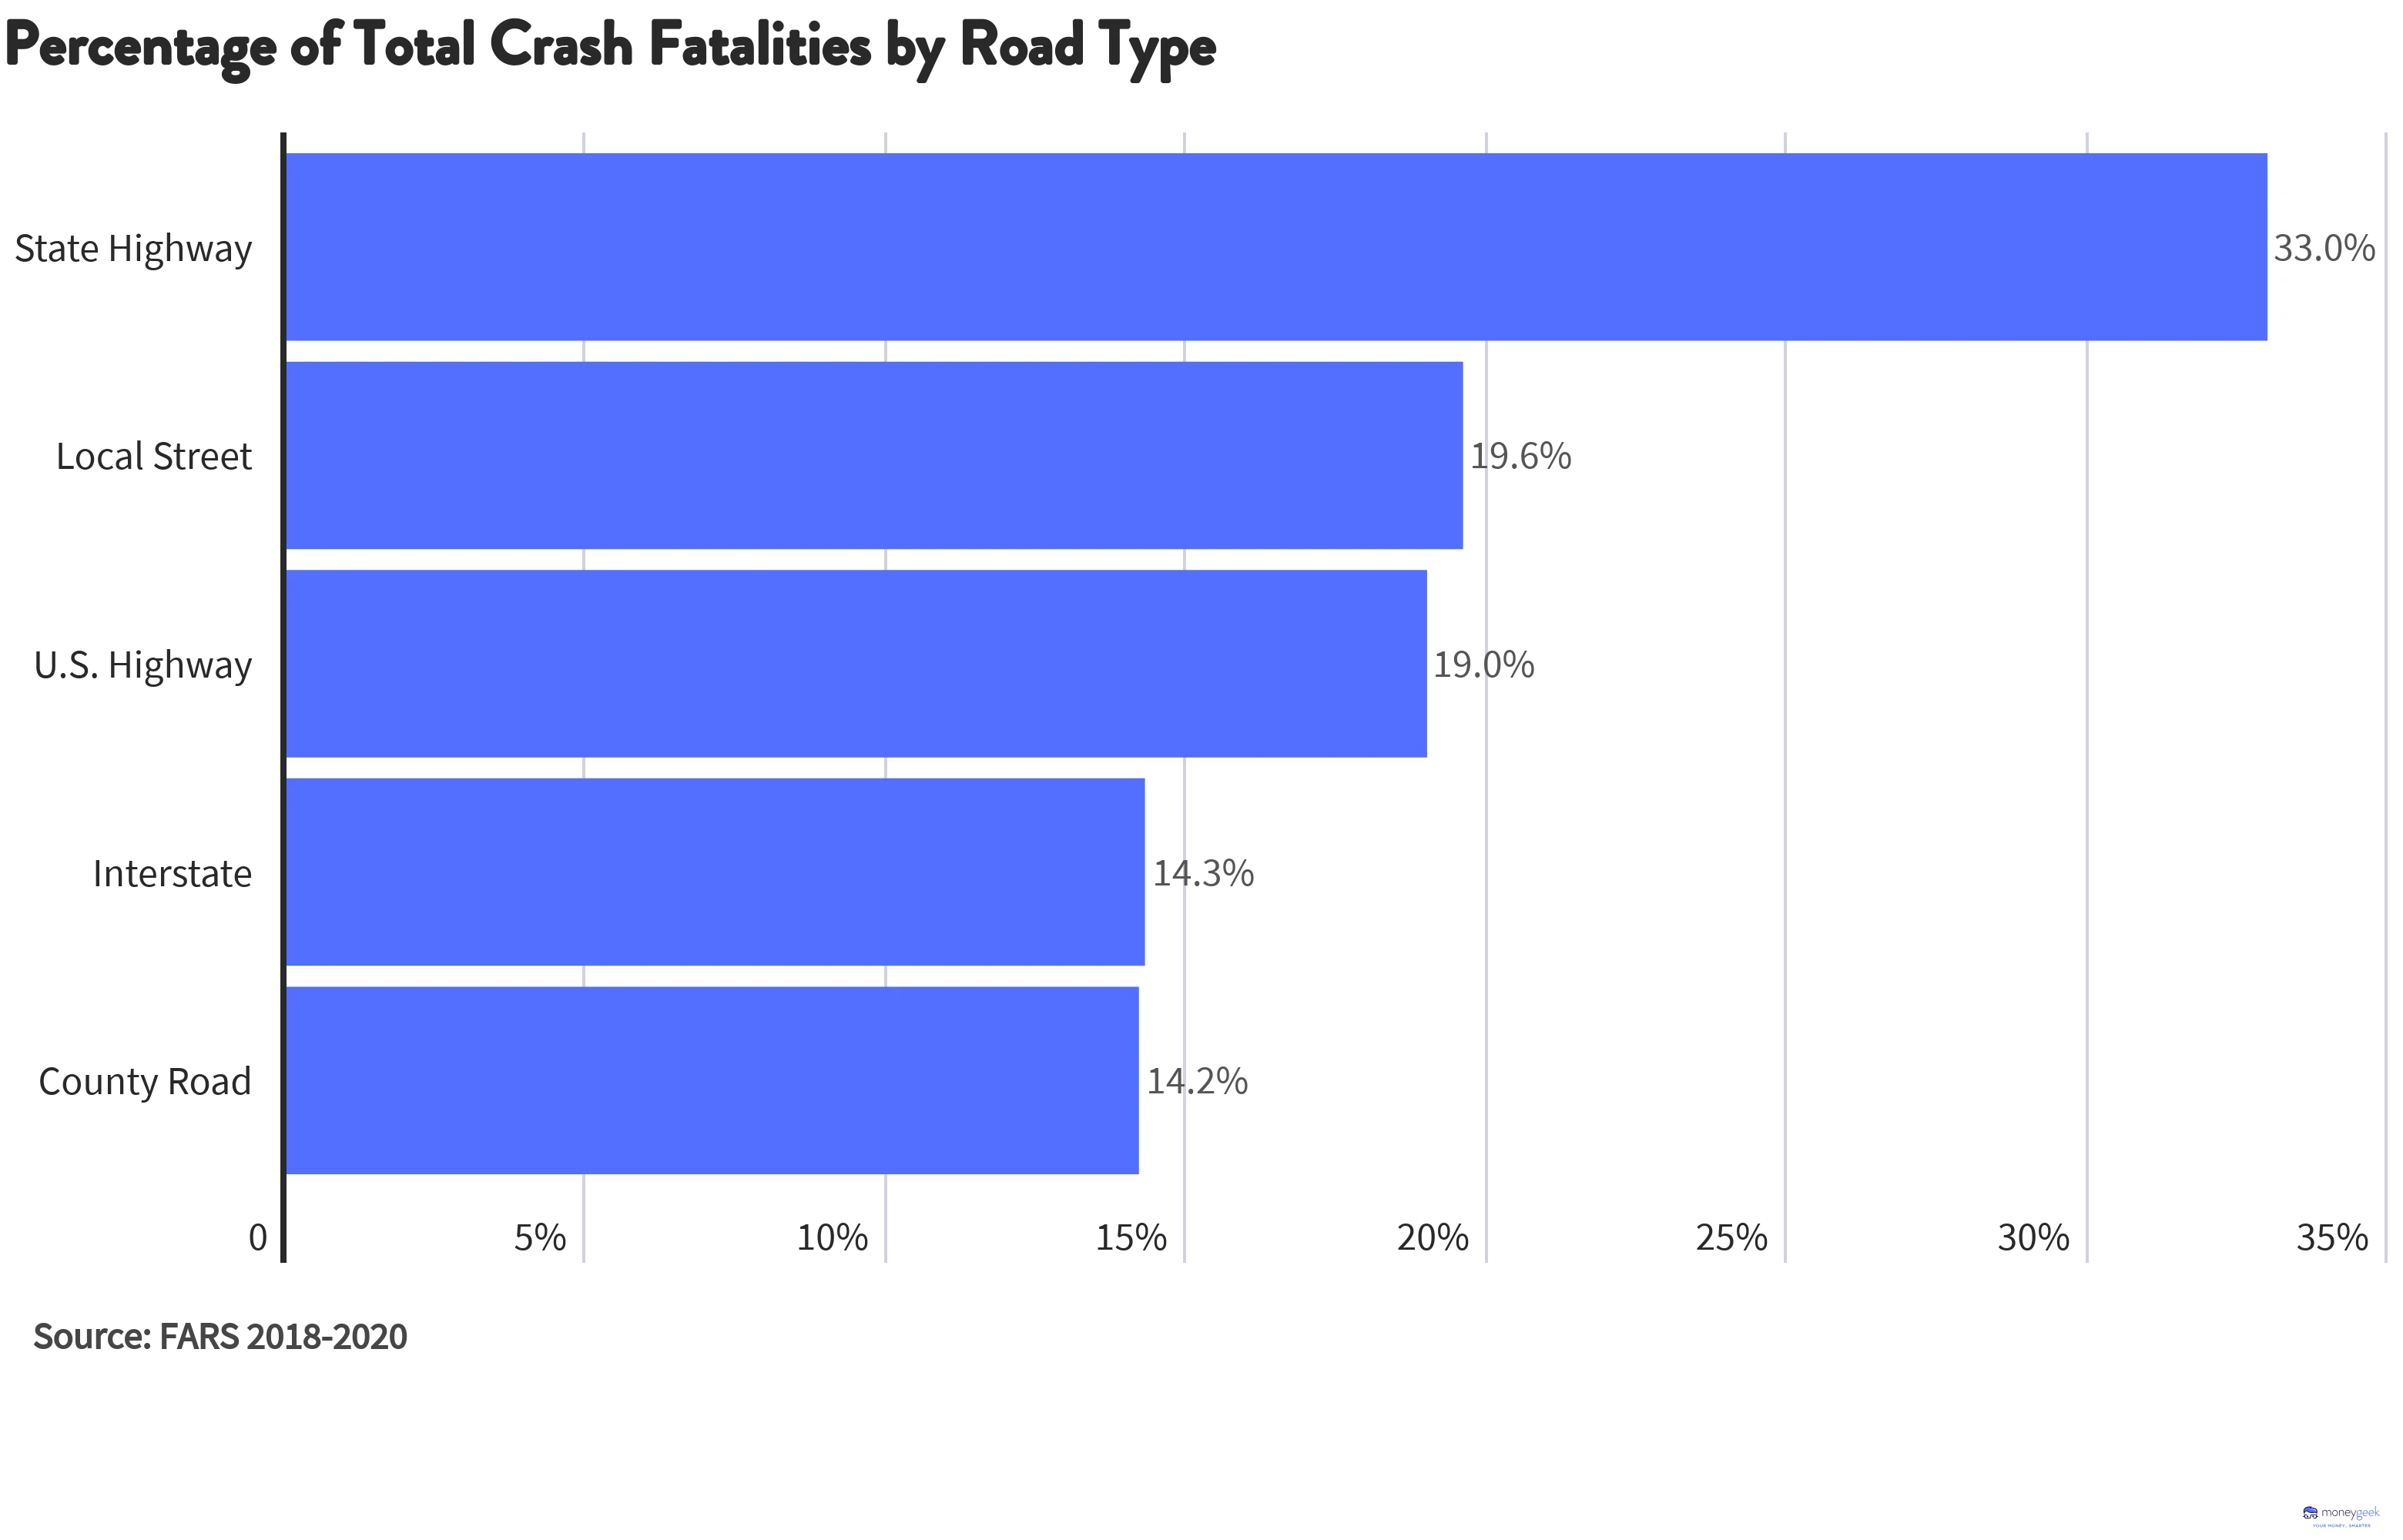
Using FARS data, MoneyGeek examined motor vehicle fatalities from 2018 to 2020 — analyzing deaths on county roads, interstates, local streets, state highways and U.S. highways — to find the deadliest types of road in the U.S. We found that state highways are the deadliest type of road overall, accounting for 1 in 3 crash fatalities, followed by local streets and U.S. highways.
In addition to calculating the most dangerous types of road overall, MoneyGeek also found the types of roads where the largest percentages of traffic fatalities occurred in every state.
We found that, while state highways were the most dangerous type of road in the U.S., they weren't the deadliest everywhere. Local streets were the most dangerous road type in nine states, U.S. highways in six and county roads in four. Interstates were also included in our analysis but were not the deadliest road type in any state.
The States With the Deadliest State Highways
State highways are the most dangerous roads in the United States, with 33% of all auto-related deaths occurring on these roads. Our study found that in 31 states, more crash fatalities take place on state highways than on any other type of road.
From 2018 to 2020, Pennsylvania’s 1,919 deaths make it the nation’s leader in this category — 57% of the state’s traffic fatalities were on a state highway, compared to the national average of 33%.
South Carolina followed close behind, with 57% of crash fatalities occurring on state highways.
STATES WITH THE HIGHEST % OF CRASH FATALITIES ON STATE HIGHWAYS
The States With the Deadliest Local Streets
Local streets are the second-deadliest type of road in the U.S., with 20% of accident fatalities taking place on them; in nine states, they’re the most dangerous type of road.
Arizona is the state with the most car-related deaths on local streets. Half of its traffic fatalities (50%) happened on these roads. Nevada placed second with 41% of crash fatalities taking place on local streets, followed by New York (40%).
STATES WITH THE HIGHEST % OF CRASH FATALITIES ON LOCAL STREETS
The States With the Deadliest U.S. Highways
The differences between state highways and U.S. highways are subtle. However, MoneyGeek’s study found that U.S. highways are significantly less dangerous than state highways; in fact, while state highways were the most deadly road type in 30 states, U.S. highways were the most dangerous in just six.
This road type was most dangerous in North Carolina, where 38% of total crash fatalities occurred on state highways. Next was Wyoming (35%), followed by Nebraska (33%).
STATES WITH THE HIGHEST % OF CRASH FATALITIES ON U.S. HIGHWAYS
The States With the Deadliest County Roads
While county roads were the least deadly type of road in the U.S., overall, they were still the deadliest roads in four states. In Minnesota, deaths on county roads from 2018 to 2020 accounted for 40% of accident fatalities, the highest percentage of any state. County roads were also the most dangerous in Michigan, New Jersey and Iowa, with 37%, 30% and 28% of crash-related deaths occurring there, respectively.
STATES WITH THE HIGHEST % OF CRASH FATALITIES ON COUNTY ROADS
Staying Safe While Driving on Every Type of Road
Life is unpredictable; we can find ourselves injured even if we stay home. That said, we can all recommit ourselves to driving safely.
It’s essential to make sure you’re financially well-protected by securing adequate car insurance coverage. Affordable car insurance is out there, and if you aren’t covered properly, you could spend a fortune on repairs in the aftermath of an accident.
Taking special precautions while driving on each road type can also help make you and others safer:
-
State Highways
You’ll want to stay in the right lane when you can; the left lanes are for passing. Keep in mind that there are more entry points on a state highway, so if you aren’t paying attention, you could be surprised by a car turning into your path.
-
Local Roads
As with any road, you should drive within the speed limit and not text while driving. You really want to be alert. Distracted driving can turn deadly, and with local roads, there are usually far more stopping and starting and lane changes than on a freeway, for instance.
-
U.S. Highways
On these roads, follow the tips you would for state highways and remember to avoid a marathon day of driving. Take advantage of the many places you can stop and rest on a state highway. The Centers for Disease Control and Prevention warns that lack of sleep can make you less alert and impact your coordination, judgment and reaction time behind the wheel.
-
County Roads
Keeping your eyes on the road and staying within the speed limit is good advice for any driving situation, but it’s imperative to do so on county roads, many of which are in the middle of nowhere. You could easily find an animal crossing the road, especially in the dark.
-
Interstates
Choose your lanes wisely. Use the left lane (fast lane) sparingly. The right lane is for slower drivers, but drivers entering the freeway won’t be immediately merging into the middle lane. Therefore, the middle lane is ideal if you are covering a long distance and don’t want to do a lot of lane switching. In other words, practice smart road safety.
Expert Insights
MoneyGeek reached out to industry leaders to get their insights on what governments can do to improve road safety.
- What do you think states could be doing to make their highways safer?
- Generally, what would you like to see cities, counties or states do to make roads safer for drivers?


Methodology
MoneyGeek analyzed FARS data from 2018 to 2020, the most recent data available, to find the total number of crash fatalities occurring on each type of road.
To calculate the deadliest type of road in each state, we analyzed all crash fatalities across each road type and identified the road type where the highest percentage of crash fatalities occurred. In our state-level analysis, interstates were not the deadliest road type for any state. Roads classified as “Unknown” or “Other” were excluded from the study.
Full Data Set
Definition of Road Types:
- State Highway: High-speed roadway owned and maintained by the state.
- Local Street: Make up the majority of roads in the U.S. and provide primary access to residential areas, businesses and other local areas, typically with posted speed limits between 20 and 45 mph. This variable combines local streets in townships, municipalities and frontage roads.
- U.S. Highway: High-speed roadway owned and maintained by the federal government.
- County Road: Roadway owned and maintained by a state-recognized municipality or town.
- Interstate: High-speed roadway that serves interstate or regional traffic from state to state.
In addition to road types, the table below uses the following terminology:
- State Highway Fatality %: Percentage of crash fatalities that took place on state highways from 2018 to 2020.
- Local Street Fatality %: Percentage of crash fatalities that took place on local streets from 2018 to 2020.
- U.S. Highway Fatality %: Percentage of crash fatalities that took place on U.S. highways from 2018 to 2020.
- County Road Fatality %: Percentage of crash fatalities that took place on county roads from 2018 to 2020.
- Interstate Fatality %: Percentage of crash fatalities that took place on Interstates from 2018 to 2020.
- Total Crash Fatalities: The sum of all crash fatalities between 2018 to 2020 for all road types in the specified state.
About Geoff Williams

Geoff Williams has been a personal finance journalist since around the time of the Great Recession of 2008. He's been writing professionally since the 1990s about a variety of topics, including personal finance, credit cards and loans.
Williams is also the author of several books, including "Washed Away: How the Great Flood of 1913, America's Most Widespread Natural Disaster, Terrorized a Nation and Changed It Forever" and "C.C. Pyle's Amazing Foot Race: The True Story of the 1928 Coast-to-Coast Run Across America."
Born in Columbus, Williams now lives in Loveland, Ohio, with his two teenage daughters.
v
