


正文
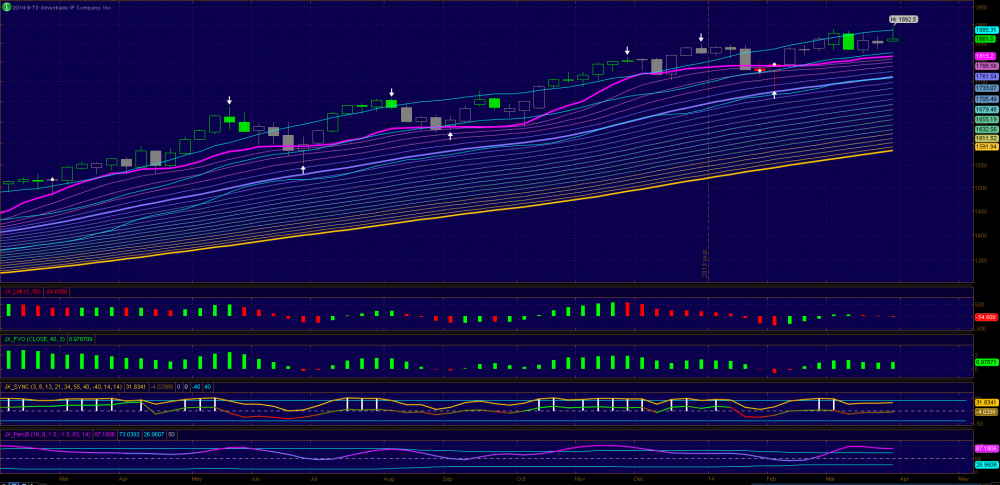
1. We have a weekly new high but ES closed on a rather weak note. Still it printed a green candle and the high touched the upper trading band. PL is slightly up and the trading band as well. So weekly ES still has a bullish bias. Except momentum is decreasing the rest indicators are all in bullish corner.
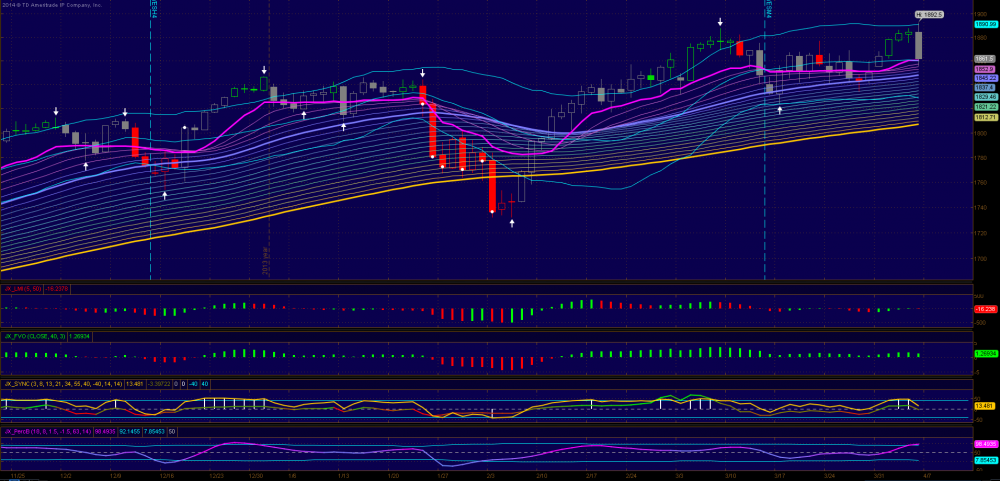
2. Daily touched the rather flat upper band and sellers piled on and ES dropped all the way to the midline and the PL(1860). Buyers should step in or the selling could snowball into a more serious situation. The zone between 51(TBL) - 60 should act as a strong support for bulls. If this fails ES is likely to test the lower trading band and the recent up move is just a upswing in a wide trading range not the start of a new bullish leg. Indicators for daily are still bullish and PL appears to have flatten again.
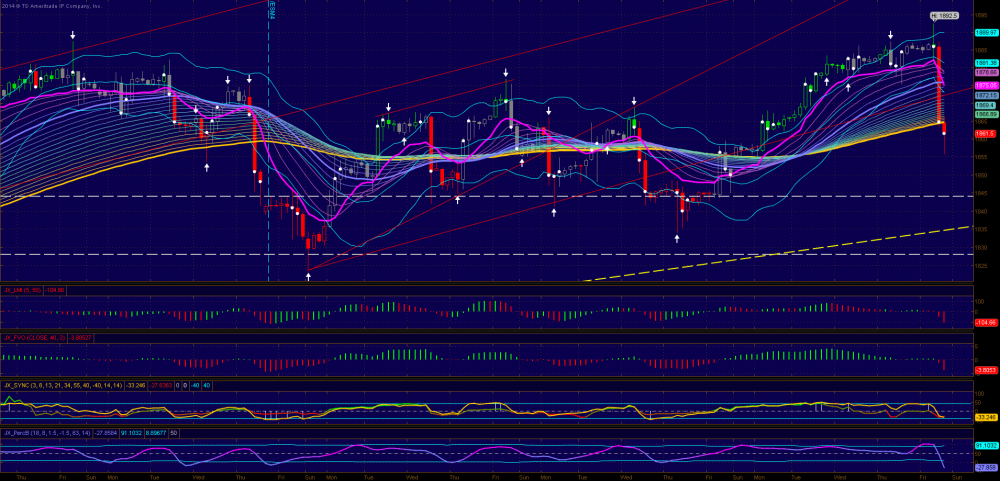
3. The drop on 3-h chart was fast. It was done from a position above a very expanded rainbow to the OTL and beyond. Indicators are quickly turned into bearish and ES is oversold. It is not as scary as it appeared. I would fear more if this started from a very tightened rainbow which could lead to a serious down trend. This action could be a test of supply at the very early stage of a bullish trend If we get a very fast rebound from here. If that is the case those who sold on Friday will have to become a buyer at a higher price and the market will go higher very quickly from here.
4. RS Levels: 88.5, 81.5, 77, 74, 68, 62.5, 58.75, 51-2, 48
Weekly
Daily
3-Hour
2. Daily touched the rather flat upper band and sellers piled on and ES dropped all the way to the midline and the PL(1860). Buyers should step in or the selling could snowball into a more serious situation. The zone between 51(TBL) - 60 should act as a strong support for bulls. If this fails ES is likely to test the lower trading band and the recent up move is just a upswing in a wide trading range not the start of a new bullish leg. Indicators for daily are still bullish and PL appears to have flatten again.
3. The drop on 3-h chart was fast. It was done from a position above a very expanded rainbow to the OTL and beyond. Indicators are quickly turned into bearish and ES is oversold. It is not as scary as it appeared. I would fear more if this started from a very tightened rainbow which could lead to a serious down trend. This action could be a test of supply at the very early stage of a bullish trend If we get a very fast rebound from here. If that is the case those who sold on Friday will have to become a buyer at a higher price and the market will go higher very quickly from here.
4. RS Levels: 88.5, 81.5, 77, 74, 68, 62.5, 58.75, 51-2, 48
Weekly
Daily
3-Hour

評論
回鄉偶書
2014-04-06 20:24:37
回複
悄悄話
謝謝老大!
登錄後才可評論.