


正文
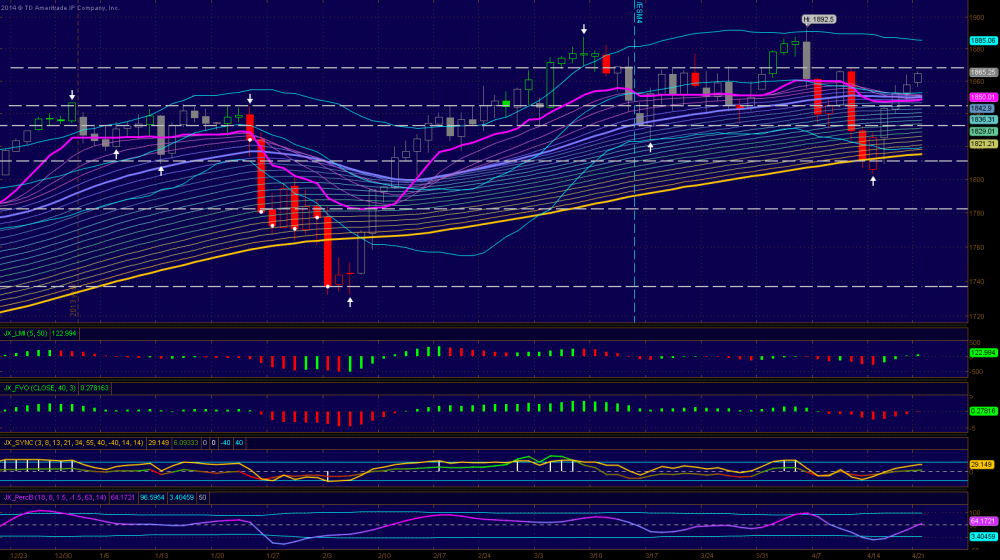
1. ES has closed above the triple lines for 2 days now and it appears that the upside momentum is building. Indicators on daily's now are almost all positive and a test of 85 is likely. Continue to watch the triple lines as the first line of defense. Aggressive bulls can buy on the intraday throwback to the triple line support.
2. On the 3-H chart ES continues its trajectory up and TBL is about to cross the TOL. So things really look good for the bulls now. Indicators are also in bullish camp. If this uptrend is for real there should be plenty of buyers on the throwback to the TOL support between 44-50s. If ES can not find support in that zone this bullish scenario will be in serious trouble.
3. RS levels: 85-87, 81, 68.5-70, 60, 57.25, 51.75, 47, 30.5, 23.5, 16.5, 03.25, 1797, and 1771
Daily
3-Hour

評論
10things
2014-04-22 06:16:51
回複
悄悄話
thanks,
CCCCCC2010
2014-04-21 17:39:05
回複
悄悄話
Thanks a lot!
登錄後才可評論.