


正文
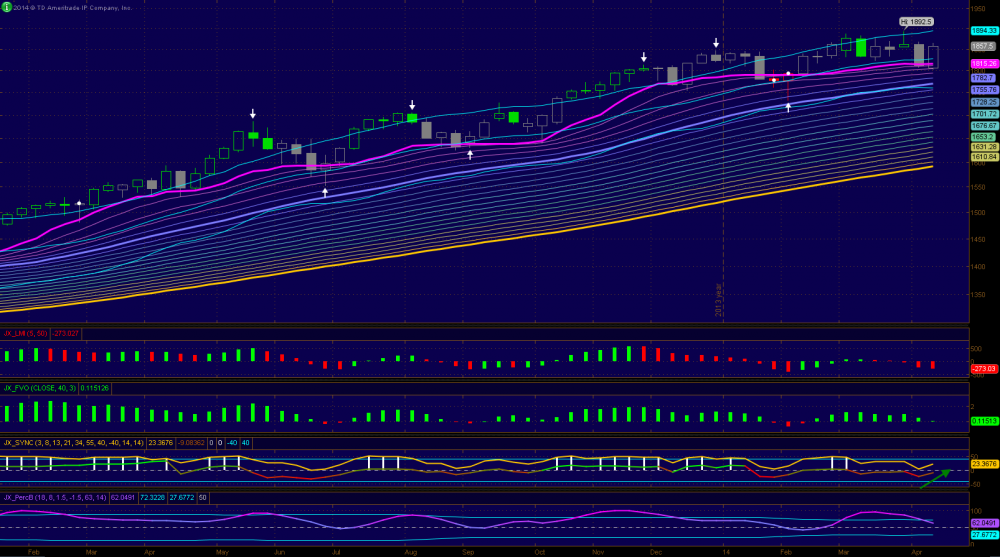
1. Weekly ES is in a relative neutral position with slightly bullish bias. PL and the lower trading band are flat. Momentum continue to decline due to recent sideway action. However SYNC bounced off zero line and FVO is still green in addition to a rising upper trading band have rendered the weekly a slightly bullish bias here.
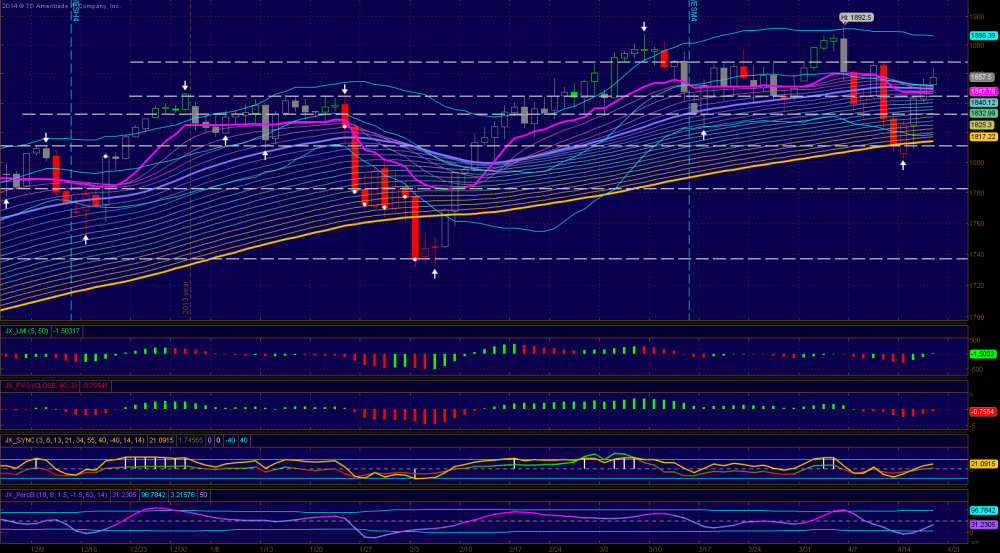
2. Friday's close printed an up candle above the three converging lines (>50) which is a promising sign for the bulls. If bulls can keep ES above these lines in the next few session we should see higher price. Momentum is rising and SYNC is positive. FVO is rising and nearly cross the zero line now with ES is somewhat oversold. Unless we have a big sell-off early next week to reverse the current direction (signs: daily closes under the triple lines) ES is setting up a test of 68.5 and the upper trading band (test the all time high). Sentiment was pretty bearish last week during the selloff as I have pointed out in my blog the likely reversal zone is between 11.5 to 97. I sensed fear among a lot of individuals (amateurs and professionals) when market hit those levels a few times. Since many have prematurely exited their long positions, shorted the market, or on the sideline, the market is setting up perfectly for a run for new highs. Be aware a possible bear trap before the next up movement if it spikes below the triples and reverses direction.
3. Indicators on the 3-hours are all bullish. PL is rising and above TBL and TOL and trading bands are also in an uptrend. Below 44 is a caution sign and under 30.5 will spill troubles for bulls.
4. RS levels: 88.5, 81, 68.5-70, 44, 30.5, 23.5, 16.5, 03.25, 1797, and 1771
Weekly
Daily
3-Hour

評論
10things
2014-04-21 05:51:07
回複
悄悄話
thanks,
CCCCCC2010
2014-04-20 14:00:13
回複
悄悄話
Thanks,I am waiting for it.
登錄後才可評論.