


正文
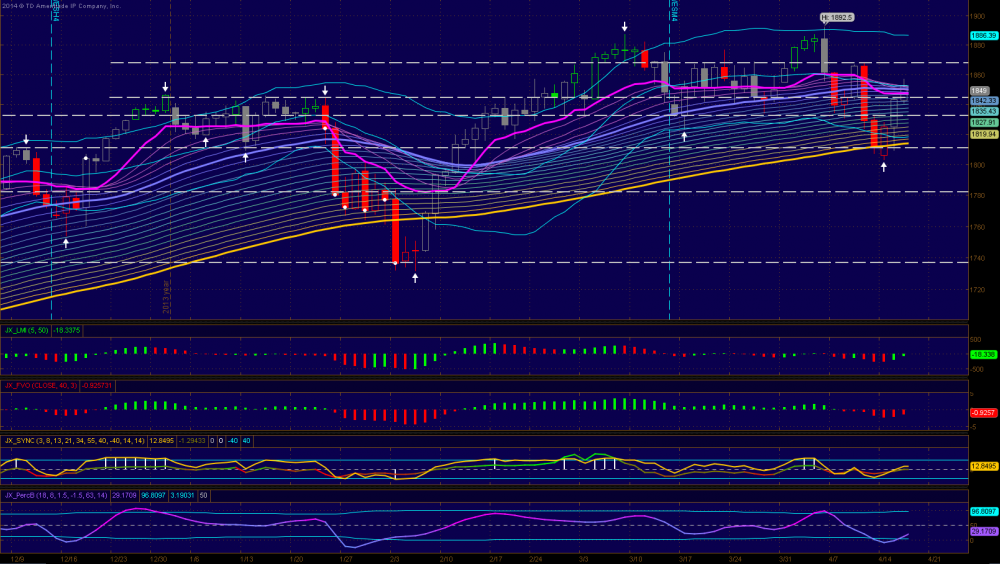
1. Daily ES went as high as the 57 resistance and retreated. The close is right at three important lines: PL, TBL, and midline of trading band which serves as a fulcrum now. Indicators are mixed and ES starts to emerge from oversold zone so there are rooms for bulls to run here if ES can stay north of the fulcrum. A failure here could lead to additional weakness and a test of the recent low.
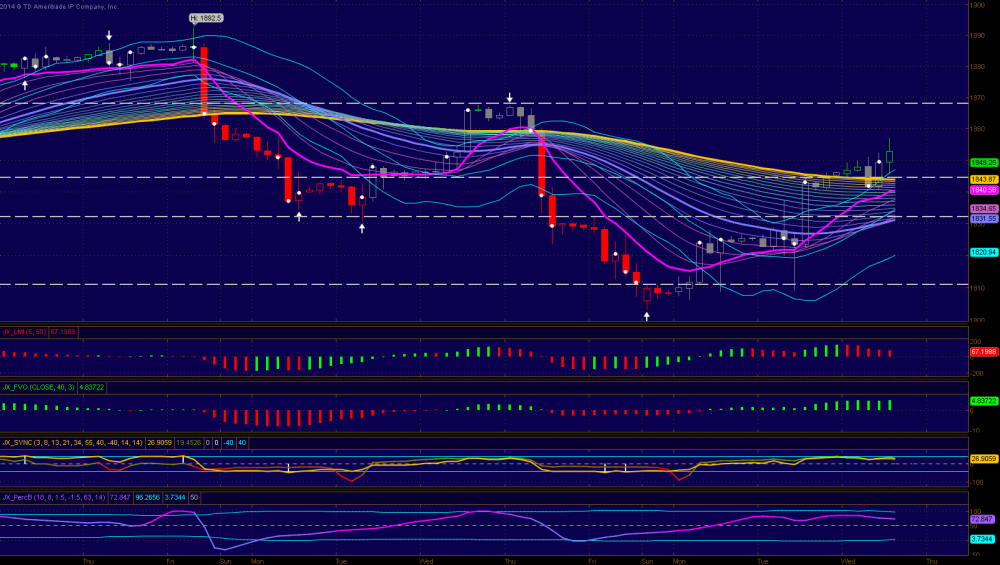
2. ES starts to print green candles which is always a good sign. However PL is still under TOL. If bears can reverse direction here things will turn ugly quickly. So watch 40.5 and 31.5 supports like a hawk. PL and trading bands are all point up and indicators are bullish.
3. RS levels: 88.5, 81.5, 77, 73.5, 68.5, 56-7, 40.5, 31.5, 23.5, 16.5, 03.25, 1797, and 1771
Daily
3-Hour

評論
10things
2014-04-17 06:17:01
回複
悄悄話
sp500 is a lot stronger than nasdaq these days. no clue where they are going.
登錄後才可評論.