


看到這裏爭論這麽多,隨便說兩句吧。網紅股和ipo的股票在格雷厄姆聰明的投資者這本書
有講到的,他強調聰明的投資者要避免買入這兩種股票,巴菲特不買這兩種股票也是深受
老師的影響。另外一位大師彼得林奇也在自己的one up on wall street上告誡大家遠離熱
門股,買自己熟悉但是不熱門的股票最好。這幾個都是有很多年投資業績的,查一下這些
書也都能看到。原因無他,有沒有在這兩種股票賺錢的,肯定有,但是比較難,而且很難
持續,另外買這兩種屬於speculate, 這個看過Graham的書的都知道。
散戶買這兩種股,甚至加杠杆的目的也很明確,就是靠這個短期致富. 2021年的時候有一
大批這種股票,比如rivian, nio的電車股,還是不少其他的,但是後麵幾乎都是掉了90%
以上,原因就是這些公司沒有自由現金流支撐。在經濟變差,貨幣流動性減弱的情況下會
暴跌,所謂暴漲和暴跌在股市裏是一對孿生兄弟的事情一再發生。
那怎麽樣才能在股市憑借較少的資金短期賺取第一桶金呢?其實還是需要有比較大機會出
現的時候,比如2020年疫情的時候,後麵很多股票都從低點翻了好多倍,你買入平時研究
比較深入的好股票持有幾年就可以。所謂的好股票是那種你幾乎能夠確定它不會倒閉,並
且未來很長的時間的自由現金流一定會增長的,或者現在情況很差,但未來大概率會好
起來的。做其他上杠杆的不是不能夠賺到第一桶金,隻是難度和風險太高,不太值得。
其它的辦法可能就是定投,節約開支,熬時間了,這個需要學習的東西可能就少多了。
隨便說說,不喜勿噴。
Understanding Stock Gaps:
Types, Examples, and
Trading Insights
:max_bytes(150000):strip_icc():format(webp)/MHP-ChipHeadshot-2-d1d3928ade0f496abeb7411d3b2e1d4f.jpg)
so many gaps when stock rise up, why some of them got filled quickly,
some of them got refilled quite late?
-
Market Sentiment: The direction of the gap (bullish or bearish) can affect
how quickly it gets filled. Bullish gaps are often filled quickly as market
participants adjust their positions to reflect the new price level. Bearish
gaps may take longer to fill as they indicate a shift in sentiment away from
-
Market Conditions: The less liquid the market, the more and bigger the
gaps. This is because less liquidity means that prices are more prone to
slipping, since there might not be anyone to take the other side of the
trade at the bid price or closely neighboring prices.
Understanding these factors can help traders make more informeddecisions about when to enter or exit positions based on the nature
of the gaps they encounter.
Stock gaps are viewed by the close and open price because they represent a
discontinuity in the price movement of a security. These gaps occur when the
price of a security opens significantly higher or lower than the previous day's close
without any trading activity in between. This discontinuity can be caused by
the security's price movement over the course of a trading day. Gaps can signal
potential market shifts, and understanding the types of gaps—common, breakaway,
grasping the different types of gaps and their potential outcomes, traders can spot
potential trading opportunities and effectively manage risks. Gaps in stock prices
are caused by sharp movements in a stock's value between trading sessions, leading
to a difference between the closing price of one day and the opening price of the next.
The main factors that cause these gaps include unexpected earnings reports, major
news announcements, changes in market sentiment, and supply and demand shifts.
Understanding Stock Gaps:
Types, Examples, and
Trading Insights
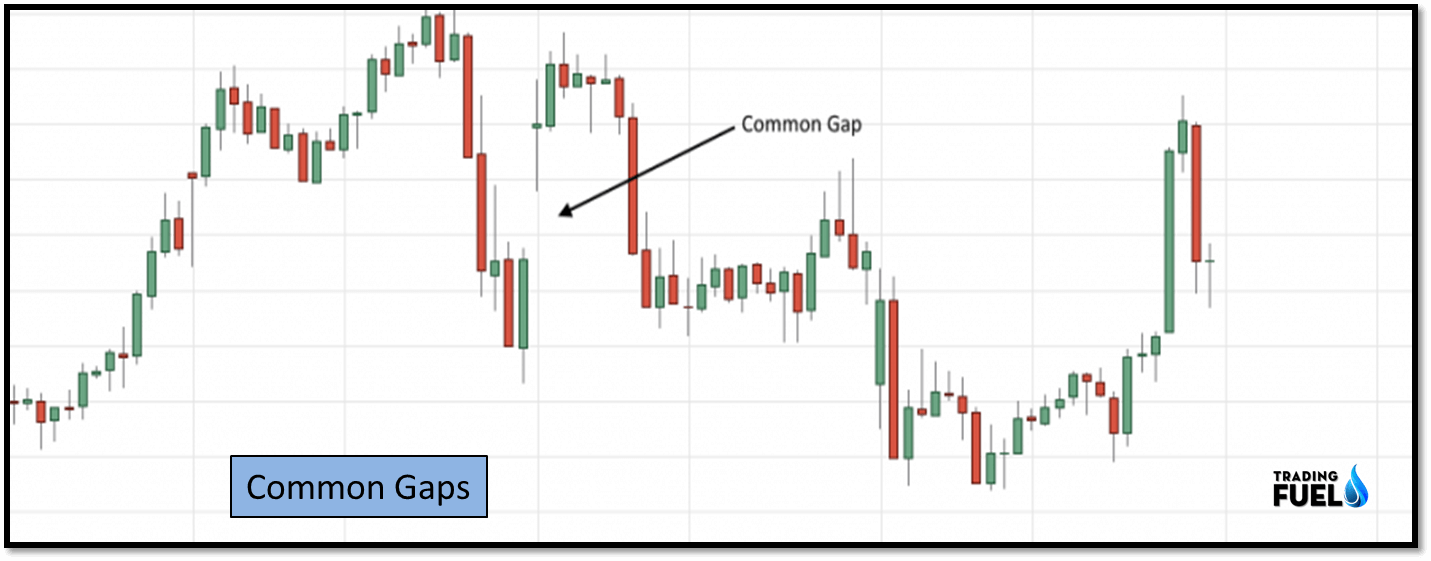
Reviewed byCommon Gap: In general, there is no major event that precedes a common
gap. Common gaps generally get filled relatively quickly (usually within a
couple of days) when compared to other types of gaps. Common gaps are
also known as "area gaps" or "trading gaps" and tend to be accompanied by
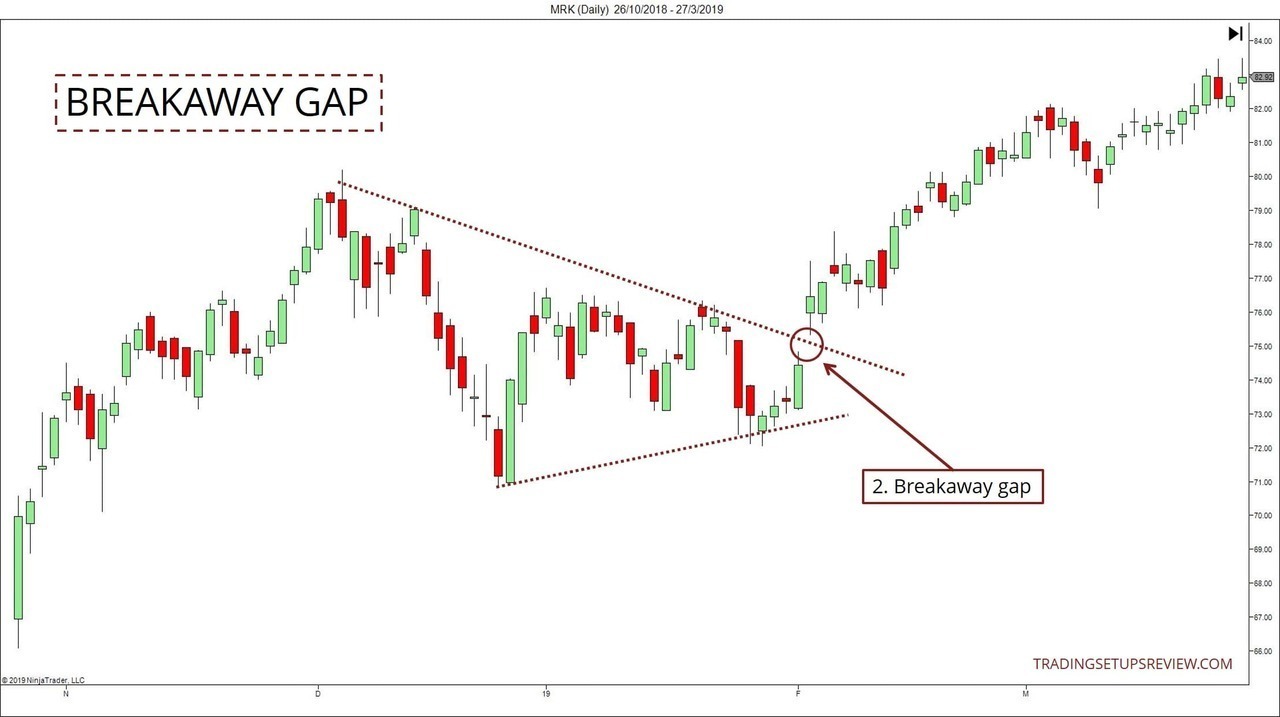
normal average trading volume. Breakaway Gap: A breakaway gap occurs
when the price gaps above a support or resistance area, like those established
during a trading range. When the price breaks out of a well-established trading
range via a gap, that is a breakaway gap. A breakaway gap could also occur
out of another type of chart pattern, such as a triangle, wedge, cup and handle,
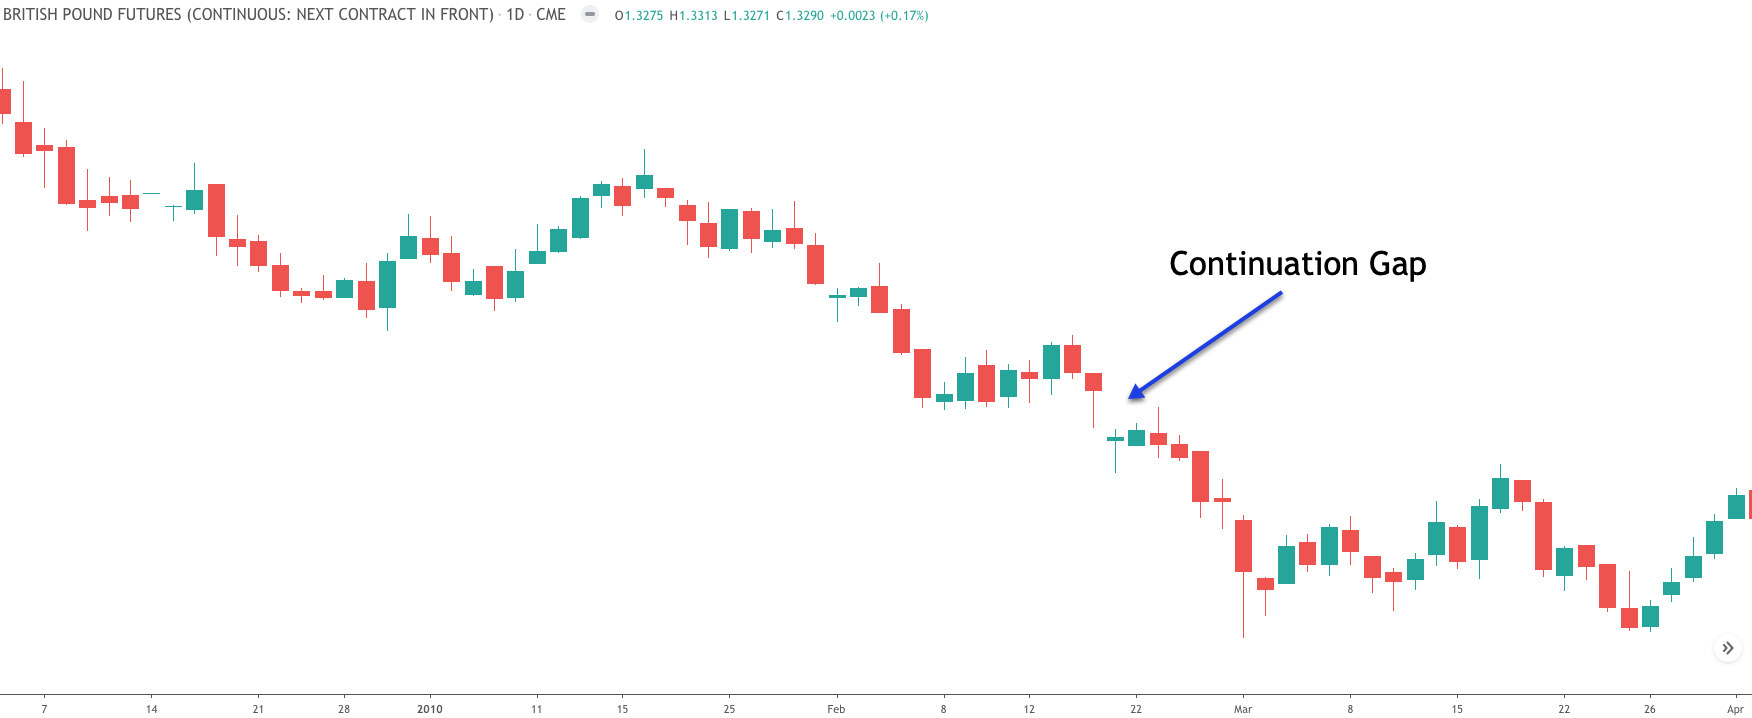
rounded bottom or top, or head and shoulders pattern. Runaway Gap:
A runaway gap, typically seen on charts, occurs when trading activity skips
sequential price points, usually driven by intense investor interest. In other
words, there was no trading, defined as an exchange of ownership in security,
between the price point where the runaway gap began and where it ended.
Exhaustion Gap: An exhaustion gap is a technical signal marked by a break l
ower in prices (usually on a daily chart) that occurs after a rapid rise in a
stock's price over several weeks prior. This signal reflects a significant shift
from buying to selling activity that usually coincides with falling demand for
a stock. The implication of the signal is that an upward trend may be about
to end soon.
Why Do Stock Gaps Fill?
A stock gap is a large jump in a stock's price after the market closes,
usually due to some news. When a gap has been filled, this means the
stock's price has returned to its "normal" price; the pre-gap price. This
happens quite often as the price settles after irrational buying and trading
has stopped after the news.
What Is Price Gap Risk?
Price gap risk is the risk that a security's price will fall or increase
dramatically from a market close to a market open, without any
trading in between. Traders should plan for price gap risk, such as
by closing out orders at the end of the day or putting in stop-loss
orders.
How Often Do Stocks Gap?
The amount of times stocks gap really depends on the time frame that
a trader is viewing and making trades. The shorter the time frame, the
more frequent the gaps. So a daily chart would have more gaps than a
monthly chart.
The Bottom Line
Stock gaps occur when an asset’s price jumps significantly between
trading sessions due to news or events, leaving a discontinuous space
on the chart. These gaps can signal the beginning of a trend or its
reversal, depending on their type. It is crucial for traders to accurately
identify these gaps—common, breakaway, runaway, or exhaustion—
and their causes, as misinterpretation can lead to missed opportunities
or losses.
Trading strategies might include playing the gap or managing price gap
risk with stop-loss orders. Understanding the implications of different
gap types helps investors make informed decisions in response to
market shifts

Gaps can be classified into four groups:
Breakaway gaps occur at the end of a price pattern and signal the beginning of
a new trend.
Exhaustion gaps occur near the end of a price pattern and signal a final attempt
to hit new highs or lows.
Common gaps can't be placed in a price pattern. They simply represent
an area where the price has gapped.
- Continuation gaps are also known as runaway gaps.
- They occur in the middle of a price pattern and signal a rush of buyers or
- sellers who share a common belief in the underlying stock’s future direction.
Gap Trading: How to Play the Gap
Part of the SeriesGuide to Technical AnalysisTraders can benefit from large jumps in asset prices in volatile markets if they can be turned into opportunities. Gaps are areas on a chart where the price of a stock or another financial instrument moves sharply up or down with little or no trading in between. The asset’s chart, on most trading platforms, shows a gap in the normal price pattern as a result. An enterprising trader can interpret and exploit these gaps for profit.
KEY TAKEAWAYS
- Gaps are spaces on a chart that emerge when the price of the financial instrument significantly changes with little or no trading in between.
- Gaps can occur unexpectedly as the perceived value of the investment changes due to underlying fundamental or technical factors, such as an earnings disappointment.
- Gaps are classified as breakaway, exhaustion, common, or continuation, based on when they occur in a price pattern and what they signal.
- The price has moved back to the original pre-gap level when someone says that a gap has been filled.
Gap Basics
Gaps occur because of underlying fundamental or technical factors. A company’s stock may gap up the next day if its earnings are much higher than expected. The stock price opened higher than it closed the day before, thereby leaving a gap.
It's not uncommon for a report to generate so much buzz in the forex (FX) market that it widens the bid-ask spread to a point where a significant gap can be seen. A stock breaking a new high in the current session may open higher in the next session, thus gapping up for technical reasons.
Automated program trading such as algorithmic trading is a relatively new source of gap price action. The algorithm might signal a large buy order if a prior high is broken. The size of the algorithmic order may be such that it triggers a price gap, breaking above the recent high and drawing in other traders to the directional movement.
Gaps can be classified into four groups:
- Breakaway gaps occur at the end of a price pattern and signal the beginning of a new trend.
- Exhaustion gaps occur near the end of a price pattern and signal a final attempt to hit new highs or lows.
- Common gaps can't be placed in a price pattern. They simply represent an area where the price has gapped.
- Continuation gaps are also known as runaway gaps. They occur in the middle of a price pattern and signal a rush of buyers or sellers who share a common belief in the underlying stock’s future direction.
To Fill or Not to Fill
The price has moved back to the original pre-gap level when someone
says a gap has been filled. These fills are quite common and can occur
due to three factors:
- Irrational exuberance: The initial spike may have been overly
- optimistic or pessimistic, therefore inviting a correction.
- Technical resistance: A price doesn’t leave behind any support
- or resistance when it moves up or down sharply.
- Price pattern: Price patterns are used to classify gaps and can tell
- you if a gap will be filled. Exhaustion gaps are typically the most
- likely to be filled because they signal the end of a price trend. '
- Continuation and breakaway gaps are significantly less likely to be
- filled because they're used to confirm the direction of the current
- trend.
It's referred to as fading when gaps are filled within the same trading
day on which they occur. Let’s say that a company announces great
earnings per share for this quarter and it gaps up at the open. It opened
significantly higher than its previous close.
Now let’s say that people realize that the cash flow statement shows
some weaknesses as the day progresses. They start selling. The price
eventually hits yesterday’s close and the gap is filled. Many day traders
use this strategy during earnings season or at other times when
irrational exuberance is at a high.
IMPORTANT
Gaps are risky due to low liquidity and high volatility but they offer
opportunities for quick profits if they're properly traded.
How to Play the Gaps
You can take advantage of these gaps in many ways. A few strategies
are more popular than others.
Some traders will buy when fundamental or technical factors favor a
gap on the next trading day. They’ll buy a stock after hours when a
positive earnings report is released, hoping for a gap up on the
following trading day if it hasn’t already happened in after-hours
trading.
Traders might also buy or sell into highly liquid or illiquid positions at
the beginning of a price movement, hoping for a good fill and a
continued trend. They may buy a stock when it's gapping up very
quickly on low liquidity and there's no significant resistance overhead.
Some traders will fade gaps in the opposite direction when a high or
low point has been determined, often through other forms of technical
analysis. Experienced traders may fade the gap by shorting the stock
if a stock gaps up on some speculative report.
Traders might buy when the price level reaches the prior support after
the gap has been filled.
You'll want to remember a few key things when trading gaps:
- A stock will rarely stop when it's started to fill the gap because there's
- often no immediate support or resistance.
- Exhaustion gaps and continuation gaps predict the price moving in
- o directions so be sure you correctly classify the gap you're going to
- play.
- Retail investors usually exhibit irrational exuberance but institutional
- investors and algorithmic systems may play along to help their
- portfolios. Be careful when using this indicator and wait for the price t
- o start to break before taking a position.
- Be sure to watch the volume. High volume should be present in
- breakaway gaps. Low volume should occur in exhaustion gaps.
Example of Gap Trading
This daily chart of Apple Inc. (AAPL) shows many gaps. This is quite
normal given the propensity for equities to gap above or below the
previous day’s price action when the market is closed but news is
still forthcoming and filtering into the market price.
We can see a bullish engulfing line starting from the left, suggesting that
the move lower may be reversing in candlestick analysis. This is followed
by a bullish gap higher, further suggesting that a low is being formed. An
attempt at the downside is made again but another large bullish
engulfing line signals a low may have been made.
We see a bearish exhaustion gap in the center, indicating that the move
higher is running out of steam and may be reversing. The gap is filled
relatively quickly but it continues to act as resistance at the horizontal
yellow arrow, suggesting that downside potential remains. Finally, we
see a strong runaway gap indicating further upside potential on the right
side amid a reversal higher.
As you can see, gaps are important price developments. They leave some
in the dust and lead others to quick profits. At the minimum, gaps are
important features of a security’s price action and should be monitored
closely for potential trading opportunities.
期權雙殺是什麽意思?期權多空雙殺行情解析
分享至期權行情多空雙殺是期權或股票市場中一種高風險現象,
表現為價格短時間內劇烈上下波動,同時觸發多頭和空頭
的止損單,導致兩類投資者均遭受損失。其本質是市場資
金博弈的極端表現,下文為大家科普期權雙殺是什麽意思?
期權多空雙殺行情解析!

一、期權交易為什麽會出現雙殺行情?
期權雙殺是指期權裏麵看漲期權和看跌期權同時下跌的情況,
這是期權市場中獨有的特色,也讓許多投資者迷惑,其實這與
影響期權價格的因素有關。
期權行情走勢出現多空雙殺是期權市場中一個較為專業的術語
,它描述的是一種市場現象,即無論市場是上漲還是下跌,投
資者都可能遭受損失。這種現象通常發生在市場波動劇烈、交易
策略不當或市場操縱等情況下。
期權交易為什麽會出現雙殺?
短期內影響期權價格的因素主要是期權的內在價值、時間價值、
波動率,而時間價值與波動率是導致期權出現雙殺的主要原因:
1.時間價值
時間越長,期權內在價值提高的可能性就越大,所以期權就
有時間價值,因此期權離到期日越近,期權的時間價值就會
越小。當期權的內在價值沒有什麽波動的時候,時間價值的
下降就會導致雙殺。
2.波動率
波動率越低,期權的相對價值也就越低,當內在價值變化不大
但是波動率顯著下降的時候,期權也會出現雙殺的局麵。
期權出現雙殺時怎麽操作?
當出現這種情況的時候,投資者最好的選擇就是空倉觀望,
如果來不及平倉,那麽就要采取一個賣出的策略。考慮作
為賣方,從而賺取時間價值的權利金。
股指期貨最低2萬一手保證金即可交易上證50,滬深300,中證500和中證1000股指期貨,文華軟件交易登錄。

二、期權雙殺是什麽意思?期權多空雙殺行情解析↑你懂得(0門檻)
什麽叫期權多空雙殺,那就是先讓你追漲,再讓
你殺跌。你信了,
就算是上當了,你不理他,他就會來理你。從技
術上來說,現在還
是盤整的一部分。用最小級別去考量市場,現在可
以認為市場的B反
彈可以結束。
但是,市場走勢往往會更複雜,一般通過幾次時間
延長的震蕩,就
會把大部分人搞到徹底投降。其實轉機往往都是
在所有人絕望的時
候出現,所以,我非常希望這裏有一次比較大的
利空考驗。
這樣市場根本不需要什麽條件,就能夠直接拉起
來。從目前的時間
周期看,距離55天的周期還有七天的時間,留意
這個周期窗口的方
向變化。
期權雙殺,也稱為“沽購雙殺”,是指在期權交易中
,無論是看漲期權
(認購期權)還是看跌期權(認沽期權),其價格
同時下跌的現象。
這一現象通常發生在特定市場條件下,例如標的資
產價格波動不足、
時間價值衰減或波動率下降等情況下。
具體來說,期權價格主要由三個因素決定:內在價值
、時間價值和
波動率。當標的資產價格波動較小時,期權的內在價
值可能不會顯
著增加,而時間價值卻會因期權到期日臨近而逐漸減
少。同時,如
果市場波動率下降,無論是認購期權還是認沽期權,
其相對價值都
會降低。這些因素共同作用,導致期權雙殺現象的發生。
期權雙殺現象最常出現在期權到期日附近,因為此時時
間價值的衰
減速度加快,且波動率下降對期權價格的影響更為顯著
。此外,在
市場橫盤整理或震蕩行情中,由於缺乏足夠的價格波動
,無論是看漲
還是看跌期權的價格都可能受到負麵影響。。
需要注意的是,期權雙殺現象雖然令人困惑,但也是
期權市場中的一
種正常現象。理解其成因和影響因素有助於投資者更
好地製定交易
策略並管理風險。
總之,期權雙殺行情的出現是市場中一個值得關注的
現象,它要求
投資者具備良好的風險管理能力、靈活的交易策略以
及準確的市場
判斷。通過不斷學習和實踐,投資者可以提高自己在
複雜市場環境
中的生存和盈利能力。
期權雙殺是指在期權交易中,無論是看漲期權(認購期權)還是看跌期權(認沽期權),其價格同時下跌的現象期權雙殺是指在期權交易中,無論是看漲期權(認購期權)還是看跌期權(認沽期權),其價格同時下跌的現象。這種現象通常發生在特定市場條件下,例如標的資產價格波動不足、時間價值衰減或波動率下降等情況下。影響期權價格的主要因素包括內在價值、時間價值和波動率。當標的資產價格波動不足時,內在價值可能不會顯著增加,而時間價值則會因期權到期日臨近而逐漸減少。此外,波動率下降也會導致期權的相對價值降低,從而引發雙殺現象【1】【2】【3】【4】。how about sell call sell put, if buy call buy put doesnt work?sell call sell put, if buy call buy put doesnt work
If the buy call buy put strategy does not work, it is important toconsider the following:Evaluate the market conditions: The success of options strategies canbe influenced by market volatility and price movements.Adjust the strategy: If the market conditions are unfavorable, consideradjusting the strategy to better align with the current market.Monitor the options: Keep an eye on the options you have sold, as theymay need to be rolled down or bought back to maintain the desiredposition.Learn from the experience: Understand the reasons for the failure and
solid understanding of the strategies and market dynamics before
6 Source期權怪象:“購沽雙殺”是怎麽
回事?為啥我看漲、看跌都不
對呢?
原標題:期權怪象:“購沽雙殺”是怎麽回事?為啥我
看漲、看跌都不對呢?
來源:期權時代
在一些初級期權交易者眼中,利用期權進行單邊交易
,無非是看跌買認沽、看漲買認購。然而,有時盤麵卻出
現了“沽購雙殺”的現象,這是怎麽回事呢?
期權“購沽雙殺”一般表現為:多數看漲期權並未同
此前指數反彈時一樣大幅上漲,而是和認沽期權一樣下跌
,且深度虛值認購期權跌幅更大。
為啥會出現單邊看跌看漲都不對的情況呢?期權交
易的正確姿勢究竟是什麽?
1
行情回顧
波動率回落,期權市場上演“沽購雙殺”
以2020年3月份行情為例,A股一度衝高,但認購期權
合約並未和市場情緒一樣,出現大幅上漲,多數虛值認購期
權跌幅反而更大。隨後,認沽認購期權曾一度出現雙邊下跌。
由於A股尾盤走弱,收盤還是以“購綠沽紅”收尾。各個期權
品種看漲期權普跌,看跌期權尾盤翻紅。
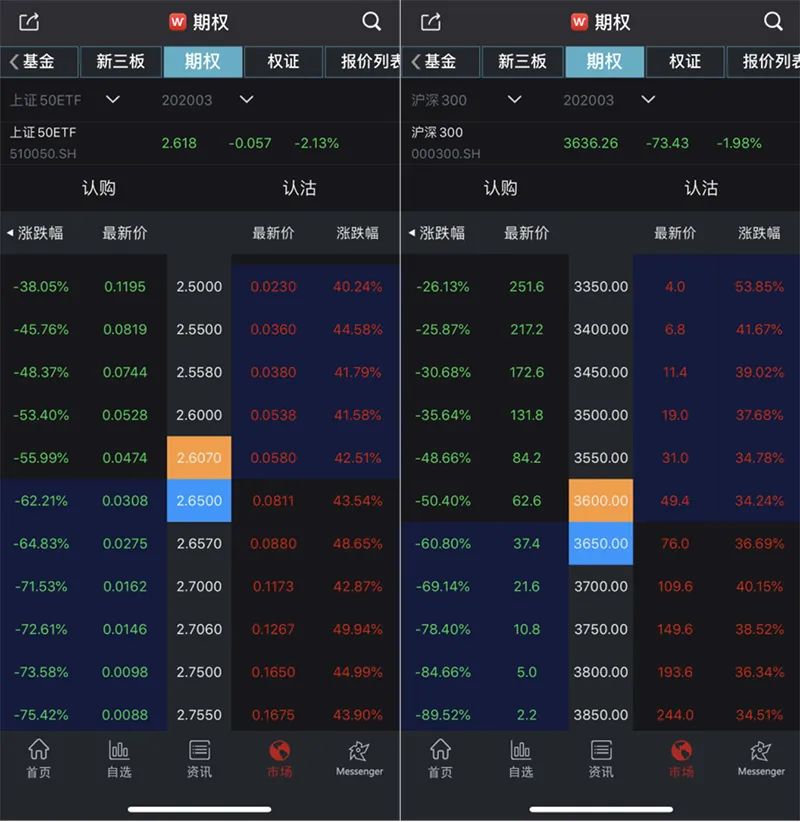
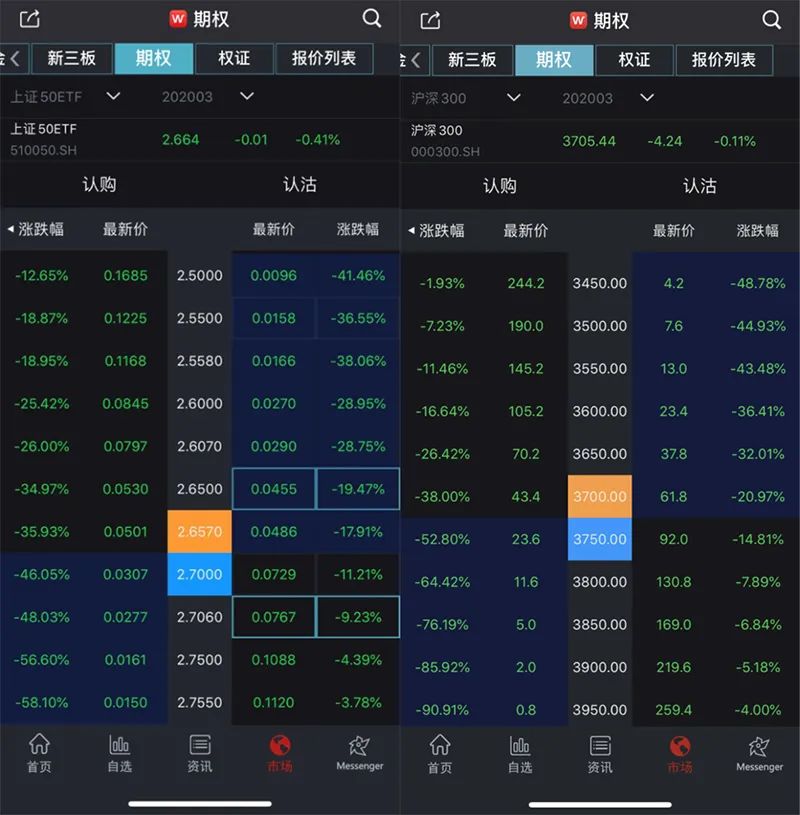
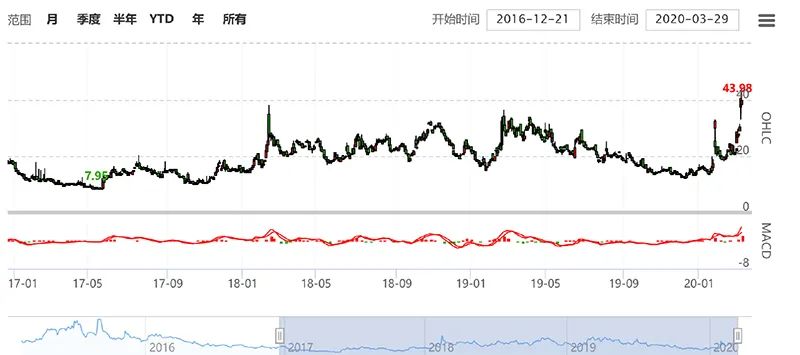
以上證50ETF為例,當時隱含波動率已經達到非常高的
水平,幾乎創下上市以來的新高。
 圖片來源:期權論壇
出現這種現象的原因大致如下:
一是因為波動率具有均值回歸的特性;
二是在2020年2月3號過後隱含波動率也是快速回落,而
之後的時間內雖然隱含波動率也持續上漲,但是曆史波動率的
位置一直維持在更高。
而隱含波動率大幅超過曆史波動率後,說明市場情緒過熱
,隱含波動率被高估,出現一定回落也是很正常現象。此外,
投資者需控製好倉位,避免滿倉賣期權,防止在市場出現波動
時因保證金不足產生額外損失。
2
深度解析
為什麽會出現“購沽雙殺”現象?
按照正常的思維理解,當標的物價格上漲的時候,買看漲期
權權利金應該上漲。當標的物價格下跌的時候,買看跌期權權利
金應該上漲。
但是盤麵出現“沽購雙殺”時,顧名思義,意思就是不管你
買的是看漲的期權還是看跌的期權,二者同時出現虧損的情況。
對於一些期權新手,難免產生疑問。下麵我們再跟大家好好
理一理這個怪現象的原因:
影響期權合約價格最關鍵的三大因素:標的漲跌、時間
價值、波動率。
標的漲跌
簡單說就是判斷方向,拋開其他因素影響,而方向的判斷
(標的的漲跌)表現在期權價格上最直接的就是內在價值部分。
而期權價格是由內在價值加時間價值,共同組成。
時間價值
時間價值說的是到期之前可能的“時間風險”(中性詞)。
當期權合約距離到期日越來越近時,對於期權買方來說,
其所持有的期權增值的可能性也越來越小。
拋開其他因素影響,因此,隨著期權臨近到期日,其時間價
值將逐漸變小,並在到期日時加速衰減為零。
所以說時間對於期權買方來說是不利的一個變量。如果再
遇上假期,時間價值理論上一定是變少的。
波動率
波動率是一種市場情緒高低的體現,即價格波動的劇烈程度
,但是並不代表行情方向。
當其他因素不變時,波動率越高期權的價格也越高,波動率
越低則期權價格越低。
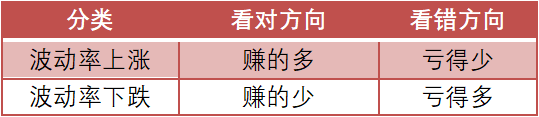
雙買策略,為做多波動率的策略,波動率下跌時,即使看對
方向,也賺的少。
若在行情沒有大變化的情況下,雙買策略收益也許為虧損
狀態。
無法達到上漲或者下跌均可能賺錢的目的。
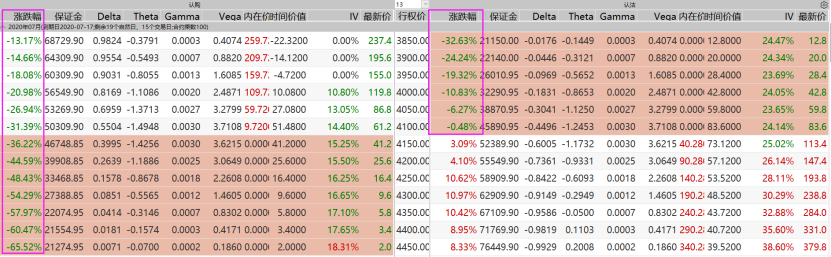
Vega值作為衡量IV變化對於期權價格的影響指標,平值
期權的Vega值最大,因此波動率的變動對於平值期權價格的
影響也會很大。
3
舉一反三
“購沽雙殺”以及其他期權價格現象
當我們大概了解了內在價值、時間價值、波動率三者對
期權價格的影響之後,可以通過以下幾組圖形對比來認識到
為什麽會出現“沽購雙殺”等其他不同期權價格現象:
我們用“1”來代表內在價值,“2”代表時間價值 ,
“3”代表波動率。
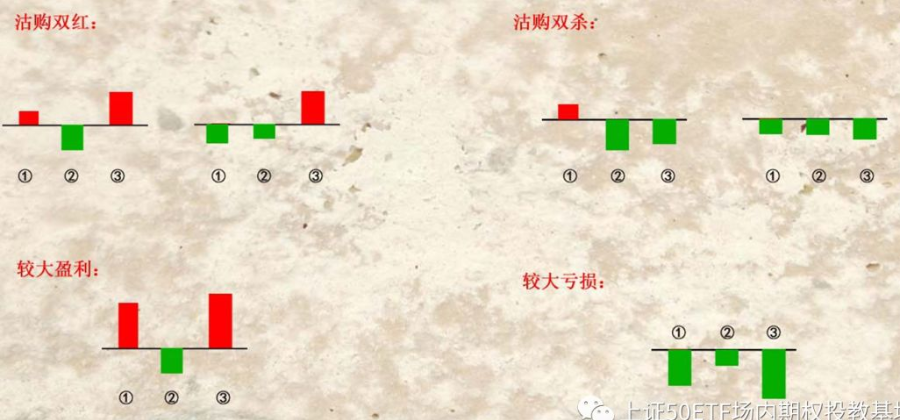
沽購雙殺
在一般波動很小的行情,方向收益微小,如果波動率
出現大幅下跌,加上時間價值的流失。體現在期權價格上就
是,認購也要虧錢,認沽也要虧錢,從而形成沽購雙殺。
(常見)
沽購雙紅
在一些特殊的行情裏,方向變化不大,如果波動率出現
大幅上漲,彌補了原本該流失的時間價值部分。體現在期權
價格上就是,認購會賺錢,認沽也會賺錢,形成沽購雙紅。
(極少出現)
價格暴漲
在一些大漲大跌的行情裏,方向帶來的增值潛力明顯,
加上波動率出現大幅上漲足以彌補時間價值的流失。體現在
期權價格上就是,做對的一方期權價格出現暴漲,真正體現
買入期權“風險有限收益無限”的時候。
價格暴跌
在大漲大跌的行情裏,如果波動率出現大幅下跌、時間
價值正常部分流失。體現在期權價格上就是,做錯的一方期
權價格出現非常大的虧損。
4
善用工具
巧用期權做對衝,事半功倍
雖然“購沽雙殺”這樣的現象雖不多見,但充分揭示了
期權交易的複雜性。
相比一味“頭鐵”地在期權市場中搏殺,投資者朋友們
更應該利用期權特有的收益不對稱性質,提前做好套保對衝,
不僅能應對股市下跌的風險,還能獲取長期穩定的收益以及
更多的時間價值。
在滬深300ETF期權獲準上市時,上交所就指出,近五年
來上證50ETF期權運行平穩,定價合理,風控措施有效,投資
者參與理性,交易和持倉規模穩步增長,市場功能逐步發揮,
為投資者提供了新的風險管理工具,新增上交所滬深300ETF
期權,豐富了投資者的風險管理工具。
股票期權對個人投資者的用途,分別是:
為持有的標的資產提供保險、降低股票買入成本、通過賣
出認購期權增強持股收益、通過組合策略交易形成不同的風險
和收益組合等。
目前來說,散戶運用較多的策略則是備兌和領口策略。
假設一位投資者在三月初持倉10萬份50ETF,市值約28萬
元,投資者可以賣10手2.85的看漲期權進行避險,如果一個月
到期時50ETF收盤價低於2.85元,那麽投資者將賺取權利金4650
元,在原有現貨倉位不變,若每月操作,一年將獲利5.6萬元。
如果到期時ETF收盤價高於2.85元時,投資者將以2.85元的
價格賣出手中的50ETF,現貨端也可賺取5000元左右的收益。
對於50ETF長期持有的投資者來說,利用期權特有的收益不
對稱性質,能獲取長期穩定的收益,還能獲取更多的時間價值。
認沽期權買方:若標的資產價格下跌,賣方需按約定價格買入標的資產
(或支付差價),買方獲利。
簡言之:賣方虧的錢,直接流入買方的口袋。
02
“雙殺”的常見場景
1. 橫盤震蕩後的突破
賣方策略:同時賣出認購和認沽期權(跨式/寬跨式空頭),賺取時間價
值衰減收益。
風險點:若標的資產價格突破震蕩區間,賣方需雙向止損,虧損可能遠超
初始收益。
資金流向:突破方向上的期權買方(如突破上漲時,認購期權買方)獲利。
2. 黑天鵝事件
示例:重大政策變動、公司業績暴雷等導致標的資產價格暴漲暴跌。
結果:賣方保證金不足被強平,買方(尤其是提前布局的對衝基金)獲利。
03
資金的具體去向
期權買方(個人/機構)
散戶:通過判斷方向買入期權,賺取賣方虧損。
機構:如對衝基金、做市商,通過波動率交易或對衝策略獲利。
市場其他參與者
做市商:為市場提供流動性,可能通過雙向報價賺取價差,但極端行情
下也可能虧損。
套利者:捕捉期權定價偏差,間接分享賣方虧損。
04
案例分析
場景:某投資者同時賣出1張行權價50元的認購期權和1張行權價
50元的認沽期權,各收取權利金2元。
情況1(未突破):標的資產價格維持在50元附近,賣方賺取4元權利金。
情況2(突破上漲至55元):認購期權買方行權,賣方需以50元賣
出標的資產,虧損5元(55-50)。
認沽期權買方放棄行權,賣方賺取2元權利金。
淨虧損:5元(認購虧損) - 2元(認沽收益) - 2元(初始權利金)
= 淨虧1元。
資金流向:認購期權買方獲利5元,認沽期權買方無損失,賣方總
虧損1元。
05
關鍵結論
零和分配:期權交易中,賣方的虧損直接轉化為買方的盈利,無額
外“第三方”獲利。
市場結構:買方可能是散戶、機構或做市商,具體取決於交易對手。
風險管理:賣方需通過倉位控製、對衝(如Delta對衝)降低“雙殺”風險。
06
延伸思考
為何賣方常被“雙殺”?
期權賣方通過收取權利金賺取時間價值,但需承擔尾部風險(
如黑天鵝事件)。買方則以權利金為成本,博取高杠杆收益。
如何避免“雙殺”?
動態對衝:通過買賣標的資產調整Delta敞口。
止損紀律:設定最大虧損閾值,及時平倉。
選擇合適策略:如牛市價差、熊市價差替代裸空頭。
期權“雙殺”的本質就是一場零和博弈,賣方虧的錢,最終都流進
了買方的口袋。不管是散戶還是機構,隻要押對了方向,就能從
賣方的痛苦中獲利。
:max_bytes(150000):strip_icc():format(webp)/AaplGapchart-9390d6a393b24f8caad9841065da8730.jpg)
 廣東
廣東 