


正文
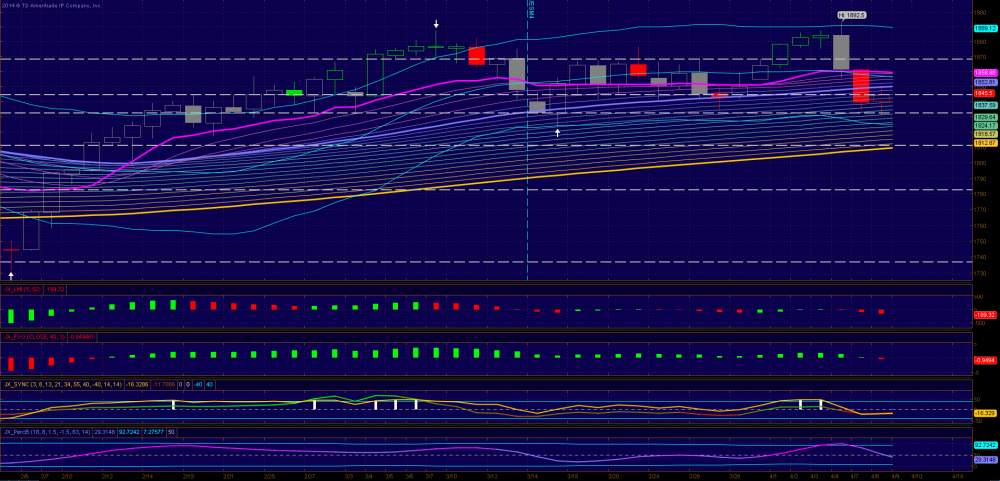
1. The important 34.5 support was briefly violated this morning however the market reversed its direction quickly after went as low as 30.75. The breach now has the look of a bear trap if ES can maintain its momentum. Actually the daily close is right on the now famous 44 level again and our minor support 41-2 has been tested several timed this afternoon and it is still intact. Daily PL is flat and continue to suggest range action and indicators starting to show some bearishness. A PL and TBL crossover has not happened yet. For bulls watch the 40 (newly adjusted) support carefully and the breach of it as an early warning for a retest 34.5 which may not hold the next time around. For bears a daily close above PL will be a bad sign.
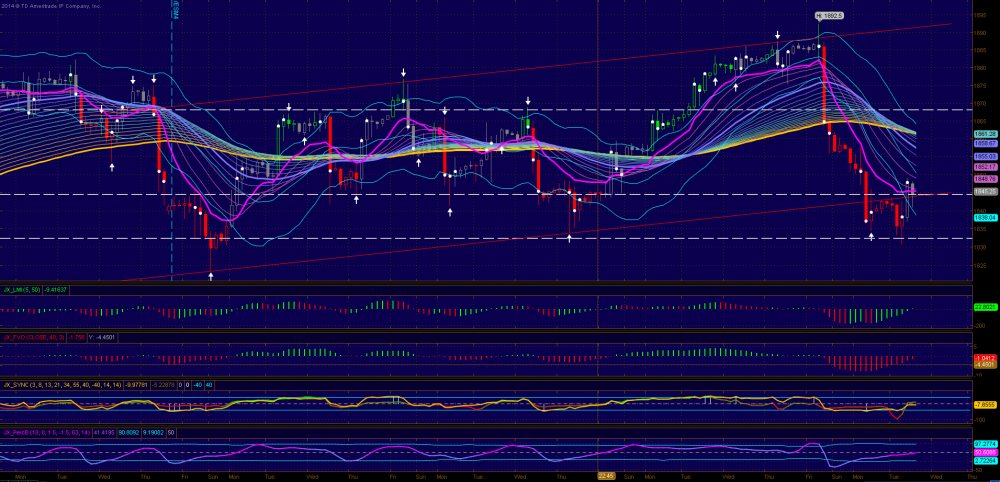
2. The 3H chart shows the potential double bottom with a positive divergence. The importance of 41 is again clearly shown here. PL is flat and the downward pressure is starting to alleviate and indicators are improving to near neutral now and should turn to bullish if no serious breakdown occurs during ON.
3. RS levels: 88.5, 81.5, 77, 74, 68.5, 64, 56, 50, 44-5, 40, 34.5, 28, 23, 11.5
Daily
3-Hour

評論
CCCCCC2010
2014-04-08 19:03:20
回複
悄悄話
Thanks!
登錄後才可評論.