


正文
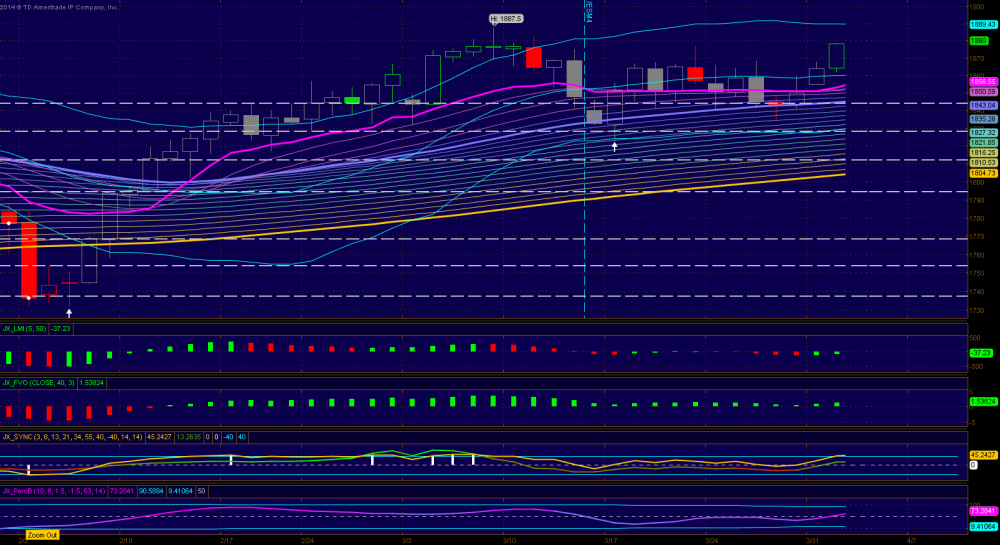
1. Daily ES printed a nice green candle and PL starts to trending up. If you have followed my blog closely you know what this means. Especially after a long period of flat PL. Indicators are all bullish and PL has kissed the TBL and bounce up. There is unlikely any immediate bearish threat now based on the chart.
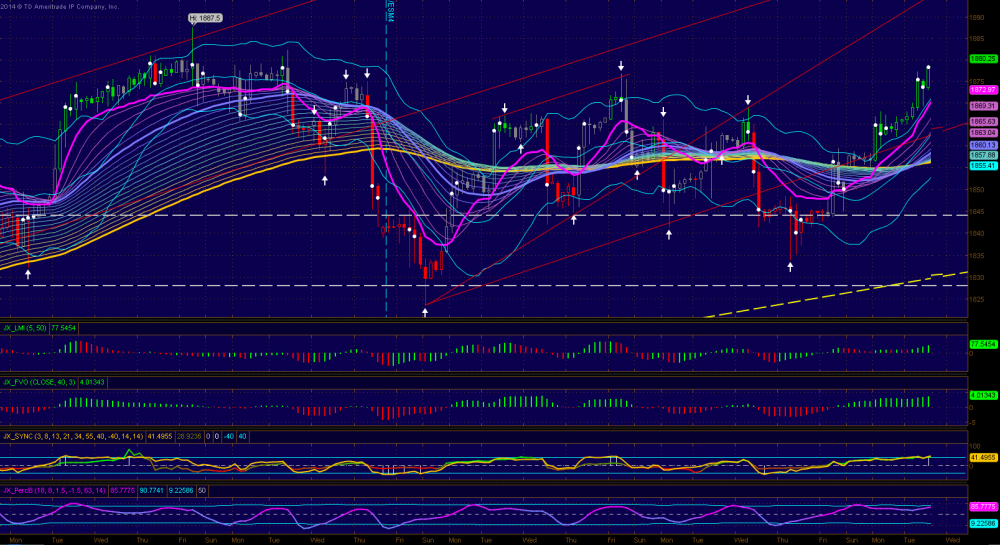
2. Rainbow has completed its rollover on the 3-h chart and PL and bands are all up. Price action is above both PL and upper band suggesting a healthy trend. A SYNC bar has been printed before the close which is another good sign. Indicators are all in bullish camp now. A test of the new high/ the upper trading band on daily is very likely.
3. RS Levels: 88, 81, 75, 68, 62.5, 58.75, 51-2, 48
Daily
3-Hour

評論
我欲因之
2014-04-01 19:48:35
回複
悄悄話
Thanks!
CCCCCC2010
2014-04-01 19:46:07
回複
悄悄話
Thanks, new high is coming!
登錄後才可評論.