


正文
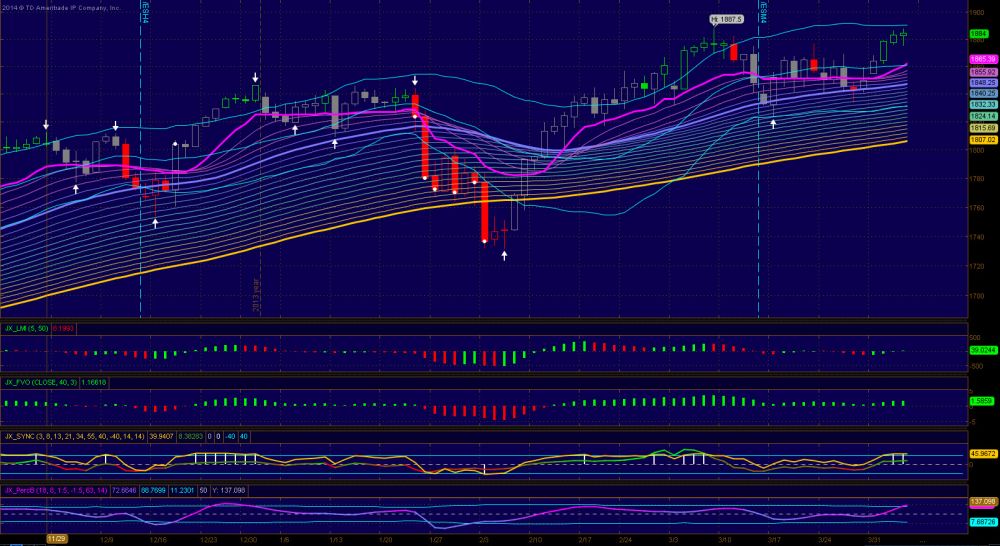
1. A relative narrow range day traded mostly sideway after a nice run is generally good to digest the gain and regain its breath for the next leg up. The strength is rather obvious with a strong finish. IN addition ES printed a SYNC bar to go along with a green candle. Indicators are bullish and daily is a bit of overbought. I think we could see a bit more sideway action here before the next big move. Trading bands are wide and flat. It is tough to get a serious move when bands are this wide. Contraction first then expand and repeat that is the way it generally goes.
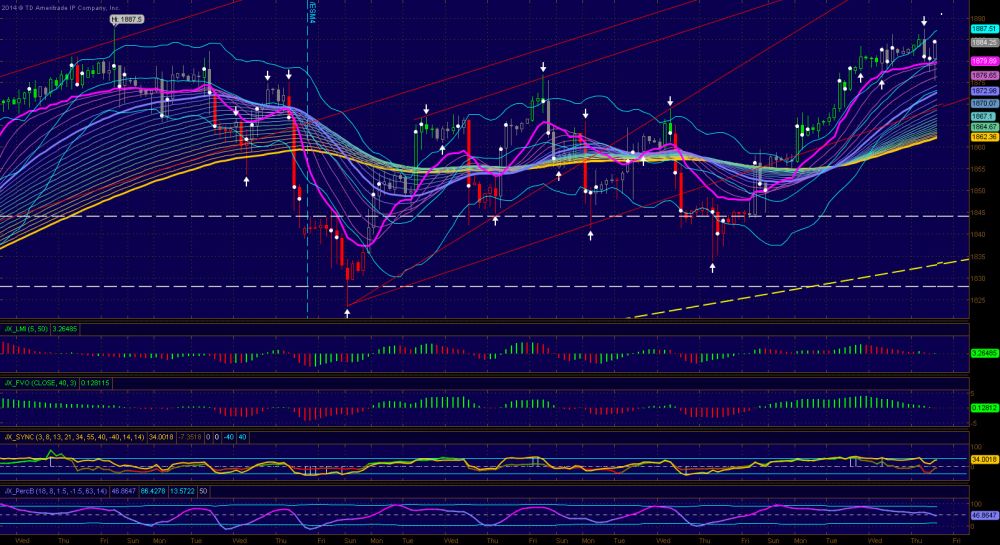
2. Momentum on the 3h chart continued to weaken. PL starts to leveling but not flat yet so there is still an upside bias. Overall indicators are still slightly bullish. The first retest of 1887.5 was a failure but the drop is mild (10 handles) and volume is not heavy which suggests lack of serious sellers.
3. RS Levels: 88, 82.5, 78, 75, 68, 62.5, 58.75, 51-2, 48
Daily
3-Hour

評論
Ophelia
2014-04-18 17:03:56
回複
悄悄話
謝謝!對我很有幫助。
CCCCCC2010
2014-04-03 19:03:55
回複
悄悄話
Thanks
登錄後才可評論.