


正文
Note: It was the week for ES contract change from H4 to M4 so Friday's data was ESM4, the June contract. So the levels are a little iffy until March expiration.
1. Weekly ES printed a green bar which is an inside candle or Harami (in this case a bearish harimi candle). A harami is a top/bottom candle formation and is not very reliable. Therefore we won't base on our analysis on this pattern alone. The weekly indicators are still in solid bullish mode except that ES is a little overbought. However considering the weekly breakout happened only 1 bar away this is expected and I am not concerned. Pinky continued its upward slope as well as our trading bands. Hence we still have a bullish weekly chart.
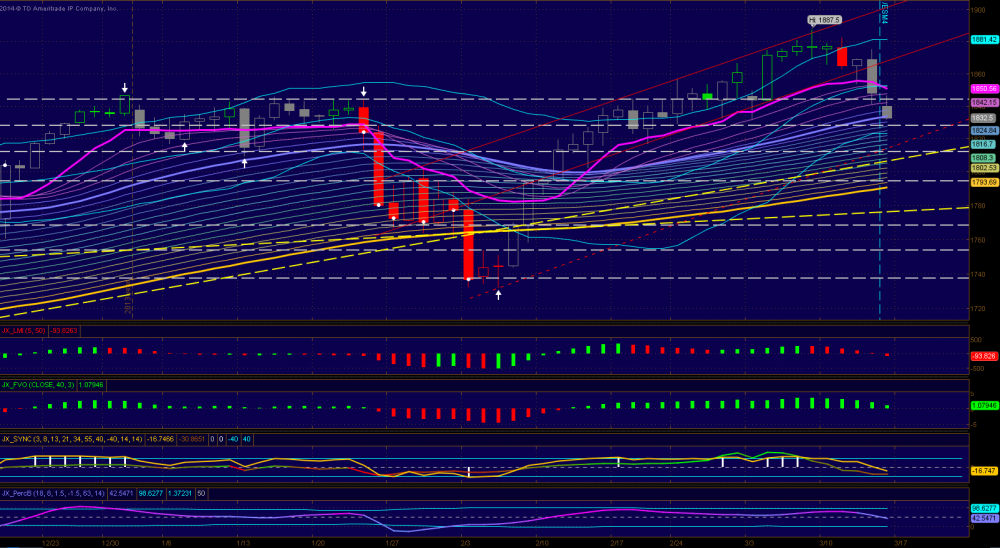
2. However daily chart is not as pretty (the contract change event made it looks even worse ). ES was unable to hold above 49 not to mention closing above 60. So the sellers dropped it to the thick blue line and on its way to test 34.5 support. Since ON low was already below 34.5 I would expect RTH to do the same to probe that level. The lower trading band is near 28 zone so the likelihood of some support will come in around there. If these could not stop selling the 18-20 and 11.5 will come in. A trend line is also nearby. Indicators are mixed and consider to be in neutral.
3. 3-hour is the chart of concern. Es consolidated below crucial support line and resolved to a follow through move to the down side. Pinky pointed down and trading was under lower trading band. Indicators are all negative if tomorrow ES can't find support at the 28 level (also overnight low so far) I think the chance for a test of 11.5 is pretty high.
4. RS levels: 46, 34.5, 28, 18-20, & 11.5
Weekly

Daily
3-hour

1. Weekly ES printed a green bar which is an inside candle or Harami (in this case a bearish harimi candle). A harami is a top/bottom candle formation and is not very reliable. Therefore we won't base on our analysis on this pattern alone. The weekly indicators are still in solid bullish mode except that ES is a little overbought. However considering the weekly breakout happened only 1 bar away this is expected and I am not concerned. Pinky continued its upward slope as well as our trading bands. Hence we still have a bullish weekly chart.
2. However daily chart is not as pretty (the contract change event made it looks even worse ). ES was unable to hold above 49 not to mention closing above 60. So the sellers dropped it to the thick blue line and on its way to test 34.5 support. Since ON low was already below 34.5 I would expect RTH to do the same to probe that level. The lower trading band is near 28 zone so the likelihood of some support will come in around there. If these could not stop selling the 18-20 and 11.5 will come in. A trend line is also nearby. Indicators are mixed and consider to be in neutral.
3. 3-hour is the chart of concern. Es consolidated below crucial support line and resolved to a follow through move to the down side. Pinky pointed down and trading was under lower trading band. Indicators are all negative if tomorrow ES can't find support at the 28 level (also overnight low so far) I think the chance for a test of 11.5 is pretty high.
4. RS levels: 46, 34.5, 28, 18-20, & 11.5
Weekly
Daily
3-hour

評論
10things
2014-03-17 05:13:09
回複
悄悄話
thanks,
登錄後才可評論.