


正文
NOTE:
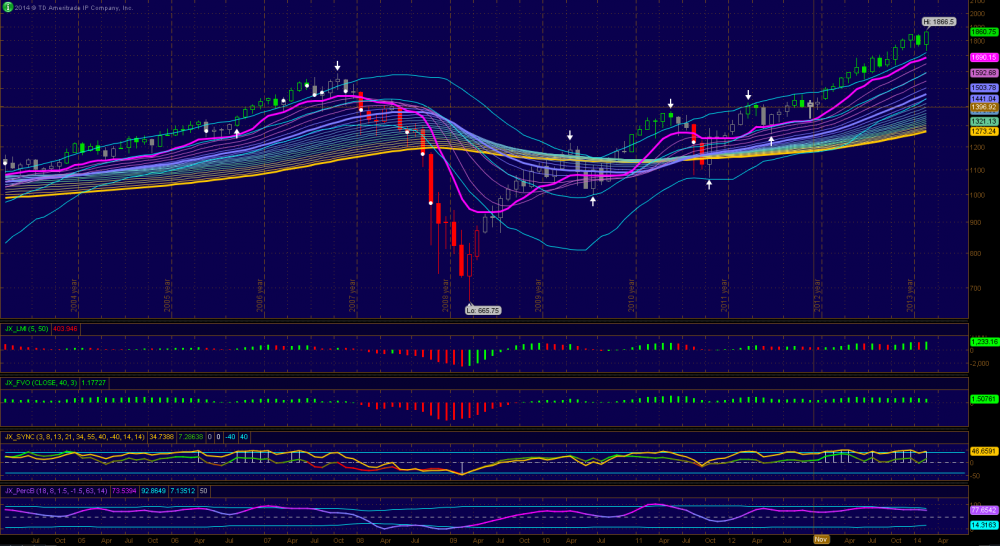
1. It is obvious that on the monthly chart ES has made a nice recovery after rough January. The monthly continues to indicate a long term bullish trend and shows no sign of fatigue. ES has been trading above the trading bands and pinky is on an upwards trajectory. Monthly indicators are as healthy as a young ox and has a long way to its prime. This chart is one of reasons that I have compared the current market to the early 1980s and believed that we are experiencing a multi-decade bull market. Buy on dips will be the overall strategy. Go back to study index charts from 1980s to 2000 and you will see even Black Monday is nothing to be fearful about in a raging bull market. Be greedy when others are fearful and fearful when others are greedy.
2. My interpretation of last week's doji candle as a consolidation was spot on. ES has done exactly what I wanted to see last week: made a new high and closed above 1846.5/ or better above 1850 (see my last week note) on weekly basis. As the new all time high is supported by a weekly SYNC bar, the intermediate term outlook is very promising. Now I would like to see pinky to move up and ES to print green weekly candles. If ES can do that 1900 is reasonable and I think 1940 area is doable.
3. Daily chart printed another green candle for a new all time high after a buy signal on Thursday (FVO>0 when LMI turned green while it is also >0. The SYNC bar is not necessary for the signal but it is a plus). Pinky is sloping up nicely and price is above and hugging the upper trading band. Further strength is expected near term.
4. Friday's interesting trading action can be best captured on the 3-hour chart. The late afternoon sell-off after making a new high and the subsequent reversal printed a long tailed hammer with a close on the upper trading band. The sell-off was fast without hesitations and pauses and ES dropped from 1860s to as low as touched our 1845 support level quickly and traded around 1848 level for a bit before rallied back to close above 60. This type of action is generally related to flushing out weak hands or gunning stops before a big rally. What they did is to test supply below 50 and found none but a lot of buyers. So now they will take the price up to see what price buyers are willing to pay and where sellers will come back in the next few sessions. Indicators are healthy and suggest bullishness near term.
5. R/S levels for DT: 44-46, and 48 support should not be violated for bulls on closing basis. Above that we have 51-2, 54-55, 59.5, 62.5-63.5, and 65.
MONTHLY
WEEKLY

DAILY

3-HOUR

1. It is obvious that on the monthly chart ES has made a nice recovery after rough January. The monthly continues to indicate a long term bullish trend and shows no sign of fatigue. ES has been trading above the trading bands and pinky is on an upwards trajectory. Monthly indicators are as healthy as a young ox and has a long way to its prime. This chart is one of reasons that I have compared the current market to the early 1980s and believed that we are experiencing a multi-decade bull market. Buy on dips will be the overall strategy. Go back to study index charts from 1980s to 2000 and you will see even Black Monday is nothing to be fearful about in a raging bull market. Be greedy when others are fearful and fearful when others are greedy.
2. My interpretation of last week's doji candle as a consolidation was spot on. ES has done exactly what I wanted to see last week: made a new high and closed above 1846.5/ or better above 1850 (see my last week note) on weekly basis. As the new all time high is supported by a weekly SYNC bar, the intermediate term outlook is very promising. Now I would like to see pinky to move up and ES to print green weekly candles. If ES can do that 1900 is reasonable and I think 1940 area is doable.
3. Daily chart printed another green candle for a new all time high after a buy signal on Thursday (FVO>0 when LMI turned green while it is also >0. The SYNC bar is not necessary for the signal but it is a plus). Pinky is sloping up nicely and price is above and hugging the upper trading band. Further strength is expected near term.
4. Friday's interesting trading action can be best captured on the 3-hour chart. The late afternoon sell-off after making a new high and the subsequent reversal printed a long tailed hammer with a close on the upper trading band. The sell-off was fast without hesitations and pauses and ES dropped from 1860s to as low as touched our 1845 support level quickly and traded around 1848 level for a bit before rallied back to close above 60. This type of action is generally related to flushing out weak hands or gunning stops before a big rally. What they did is to test supply below 50 and found none but a lot of buyers. So now they will take the price up to see what price buyers are willing to pay and where sellers will come back in the next few sessions. Indicators are healthy and suggest bullishness near term.
5. R/S levels for DT: 44-46, and 48 support should not be violated for bulls on closing basis. Above that we have 51-2, 54-55, 59.5, 62.5-63.5, and 65.
MONTHLY
WEEKLY
DAILY
3-HOUR

總結的太好了.
Thanks for your hard work.