A Novel Volume Oscillator for Detecting Smart Money Flow in Financial Markets
Volume (the number of shares or contract of a security traded over a specific period) is a very unique parameter in technical analysis. It measures the extent of trader participation, emotion and interests in a security. When a price appreciation is accompanied by rising volume, the security is in demand. If price falls significantly with little changes in volume, it indicates most of traders are not interested in selling and supply is low; some traders have become panic and misjudged market. Increasing volume confirms price movement and decreasing volume contradicts price direction.
Volume leads price and increases in volume often precede big price movements. It is the driving force behind price. Price will go up when there is more buying (demand) than selling and go down when there is more selling (supply) than buying.
Most retail traders fail to realize the significance and importance of trading volume. Price and volume are intrinsically linked and should not be viewed separately, a common mistake made by non-professional traders.
For years I have been experimenting with above volume price based indicators in my trading and the result was not very satisfactory. Finally last weekend a lighting bulb went off and I came up with my own volume price indicator with some desirable characteristics. First it is an oscillator swinging between 0 and 100 with defined overbought and oversold boundaries. Only a few of above mentioned volume indicators mentioned above can provide overbought/oversold information. Second it is much smoother than other volume indicators. Last the price element renders it a RSI-like appearance and can be used to replace momentum indicators such as RSI.
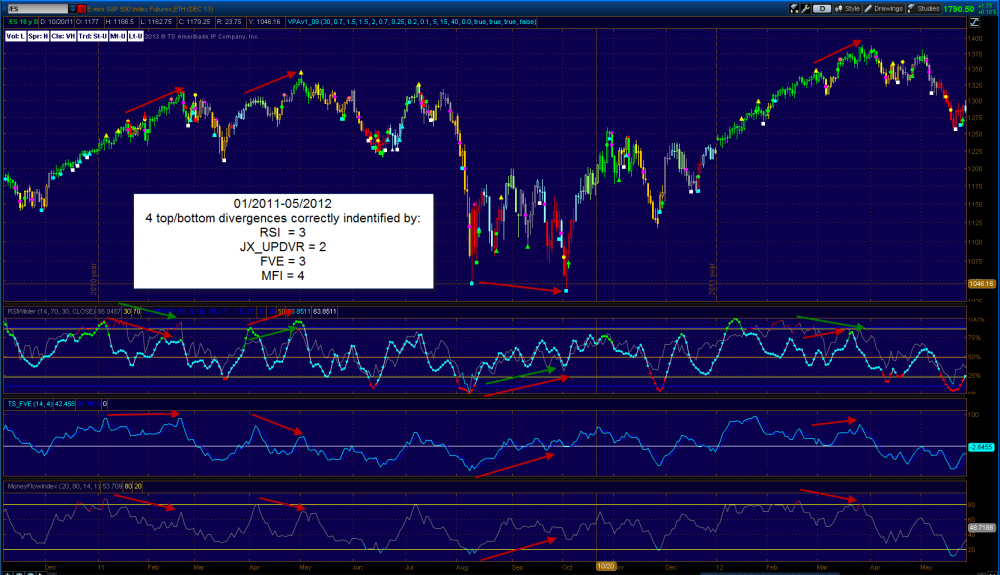
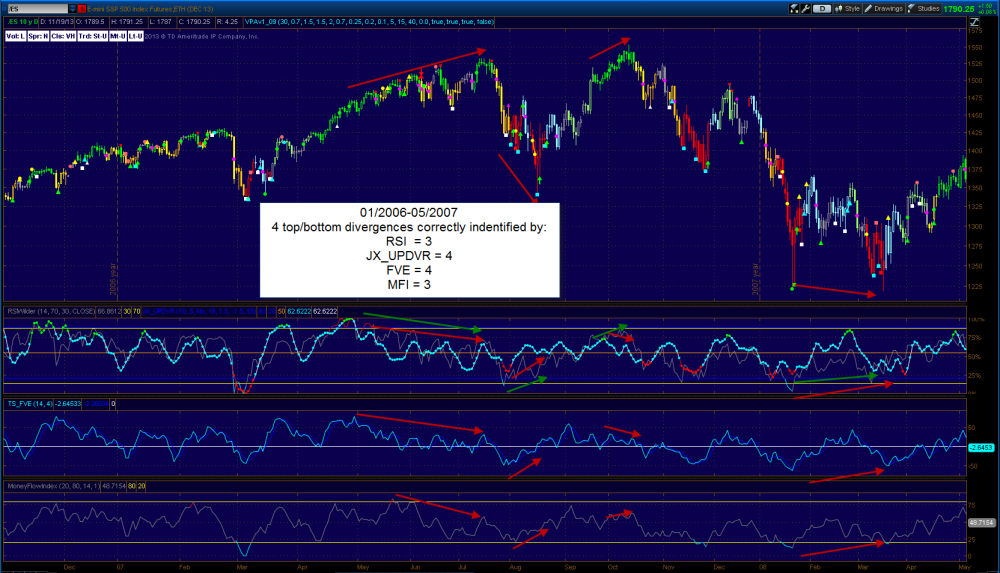
Well does it work? Programming a back-test strategy is asking too much for my elementary coding skill. One of my favorite trade strategies is to use indicator divergence to spot potential market reversal by comparing an indicator with price direction. Typically indicators such as RSI follow price direction closely. When price goes higher, so will the indicator. Divergence occurs when price and indicator disagree with each other and heading to different directions.
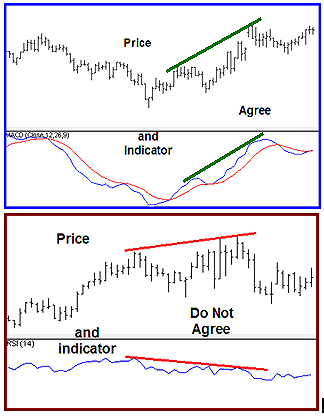
Divergence in an uptrend occurs when price makes a higher high, but the indicator fails to do so. In a downtrend, divergence happens when price makes a lower low, but the indicator does not make a lower low. When divergence is spotted, there is a higher probability of a change in price direction. The testing strategy I have chosen to use is similar to Markos Katsanos’ that is to see how successful it is in identifying divergence. I plotted 10 years of ES historical data with the following indicators: two of the three best money flow indicators according to Markos Katsanos (FVE & MFI), RSI and my volume indicator (JX_UPDVR , no official name yet) and visually counted how many divergences each indicator have identified and calculated the success rate (%). Here is the result:
|
|
Numbers of Identified divergence by any indicators |
Total |
% success |
||||||
|
Chart segment |
A |
B |
C |
D |
E |
F |
G |
10 yrs of ES data |
|
|
total # of divergences |
6 |
4 |
4 |
2 |
4 |
3 |
3 |
26 |
|
|
RSI |
2 |
3 |
2 |
1 |
3 |
3 |
1 |
15 |
58 |
|
JX_UPDVR |
6 |
2 |
4 |
1 |
4 |
2 |
3 |
22 |
85 |
|
FVE |
3 |
3 |
4 |
1 |
4 |
2 |
3 |
20 |
77 |
|
MFI |
3 |
4 |
4 |
0 |
3 |
3 |
3 |
20 |
77 |
Conclusion
- Surprisingly the popular momentum indicator RSI is not very good in identification of divergence. It has failed in over 40% of divergence.
- Overall price and volume based indicator are better suited for trading a divergence based strategy since all 3 tested volume based indicator have identified over 75% all identifiable divergence.
- UPDVR has performed slightly better (85% vs 77%) than the two volume indicators (FVE and MFI) considered by Markos Katsanos as top volume indicators. Therefore the endeavor for a new volume indicator appears to be a success based on this study.