


2011 (1)
2016 (1035)
2017 (752)
2018 (978)
2019 (385)
2020 (175)
2021 (235)
2022 (101)
2023 (983)
2024 (800)
2025 (537)

View the 2017 infographic
The World of Submissions - manuscript origins 2012-2016
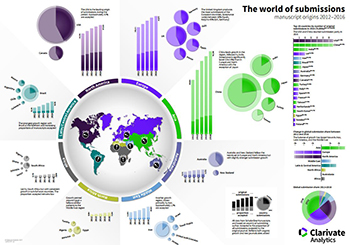
Looking at the data, what insights emerge?
You know that the research landscape is changing. The annual growth rate of scientific and scholarly journals is 3.5%, meaning that with the current number of titles, there's almost a thousand new journals every year - and that will only keep increasing. Keeping a pulse on all these changes can be overwhelming.
Looking at the submissions, reviews, and decisions data of journals over the last five years (2012 – 2016), what insights about scholarly publishing emerge? Utilizing aggregated data from ScholarOne Manuscripts and Web of Science, we’re exploring insights by country, region, subject category, and more, and what all this data might mean for the future. Through a series of webinars, infographics, white papers, articles, and formal and informal discussions, we want to engage with you about these Scholarly Publishing Insights.
Catch Up
This year at the 2017 Frankfurt Book Fair, Ian Potter of Clarivate Analytics presented his updated analysis. You can access his presentation:
