The CBOE SKEW Index (SKEW) values, which are calculated from weighted strips of out-of-the-money S&P 500 options, generally rise to higher levels as investors become more fearful of a negative equity “black swan” event — an unexpected event of large magnitude and consequence.
Key facts about recent SKEW values --
- TWO DAYS IN A ROW. SKEW closed at 143.43 on January 18, and 141.03 on January 19 (the sixth time in its 27-year history that the index closed above 140 two days in a row);
- HIGHEST IN SIX MONTHS. The January 18 value of 143.43 was the highest since June 2016 (the month of the Brexit election);
- NINTH HIGHEST LEVEL. The January 18 value of 143.43 was the ninth highest level for SKEW in more than 6,800 days of price history dating back to January 1990.
- HIGHER IN RECENT YEARS. The average value of SKEW (since the beginning of its data history in 1990) has been 118.4. Prior to 2014, the highest average daily closing value in any year for the SKEW Index was 122.5, but in each of the years 2014, 2015, 2016, and year-to-date 2017, the average daily closing level for the SKEW Index was 127.5 or higher.
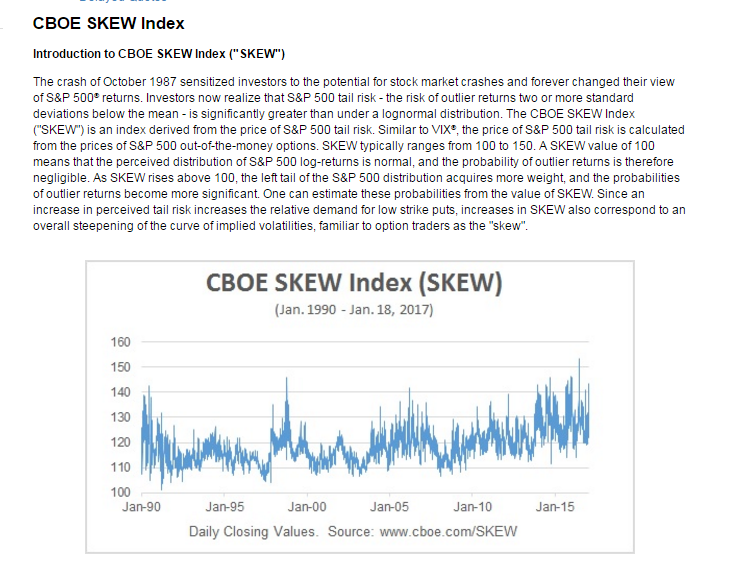
CHARTS ON CBOE SKEW INDEX
Since June 2016 SKEW topped 140 on three days – November 3, and January 18 and 19.


MORE ON SKEW
The value of SKEW increases with the markets anticipated tail risk of S&P 500 returns. If there were no tail risk expectations, SKEW would be equal to 100.
The FAQ on the SKEW Index notes that –
“The price of S&P 500 skewness is inconvenient to use directly as an index because it is typically a small negative number, for example -.8, -2.3, or -4.3. SKEW converts this price as follows: SKEW = 100 – 10 * price of skewness. With this definition, a price of -2.1 translates to a SKEW value of 121. S&P 500 options with 30 days to expiration are generally unavailable. SKEW is therefore interpolated from two “SKEW” values at the maturities of nearby and second nearby options with at least 8 days left to expiration.”
LIVEVOL SKEW CHART FOR SPX OPTIONS
The SPX volatility skew chart with estimates from Livevol shows that some of the out-of-the-money SPX put options with a 2050 strike price and January 2017 expirations had estimated implied volatilities of 25 or more.