子夜讀書心筆
寫日記的另一層妙用,就是一天辛苦下來,夜深人靜,借境調心,景與心會。有了這種時時靜悟的簡靜心態, 才有了對生活的敬重。Mr. Bruce Kasman of JP Morgan Chase (JPM) updated his GDP forecast on Friday afternoon. His prior forecast was on the rosy side. His revised assessment is decidedly optimistic. Several other street economists rushed to joined Mr. Kasman’s sunny view this weekend.
The JPM view is that GDP will recover by the 3rd quarter and resume positive growth in the 4th quarter. I believe that this is overly optimistic, but, Mr. Kasman is a fine economist and while his targets might not be achieved, the direction of things to come is becoming clearer. Some form of recovery is in the making. As green shoots go, the Morgan-Chase report is as ‘green’ as I have seen.
Assume this happens. It means that by the end of the summer things are going to ‘feel’ a lot better. The year over year numbers will be looking progressively brighter. Demand for all manner of things will be on the up-tick. It is likely that prices will be on the rise.
It is very difficult to imagine how Mr. Bernanke can expand his program of dynamic easing if those are the conditions that we will be facing in six short months. I would go as far as to say that it is virtually impossible for the FED to continue to print money at the rate they are currently doing if the economy is actually in recovery.
Mr. Bernanke is an excellent student of history. He knows what excessive expansion of money supply did to the economy in the early 80s. If Mr. Bernanke is forgetful, he has the benefit of Paul Volker looking over his shoulder.
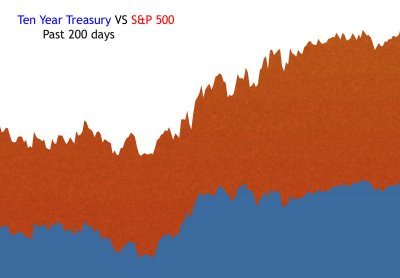
Correlations in financial market are always fun to observe. They come and go. While they exist they provide clues to the market. When they end there are usually fireworks. The ten-year Treasury bond and the S&P 500 have been highly correlated for the past 200 days.
The following graph plots the daily moves of the S&P and the ten year bond. The graph measures the percentage change of the index versus the average for the period. Notice the many points in this chart that ‘line up’. When both short-term ‘blips’ as well as longer-term trends move like this I get interested.
On March 18, 2009 Mr. Bernanke revealed that the Fed would buy up to $300 billion of Treasury bonds in support of its goal of lower interest rates. On that day the ten year Bond closed with a 2.53% yield. Now, only 30 trading days later, the bond is yielding 3.16%. In bond land that is a very big change. It is also a red alert for both the Fed and Treasury that they are not going to get a recovery and low interest rates. Something will have to give.
This week is yet another record setting auction schedule. The dealers are getting fat with the predictable supply. Getting short in front of the auctions is proving to be good business. Money making trades become self fulfilling. The pressure on rates will continue with every headline that shows any renewed life in the economy and the unending supply of paper in front of us. The Treasury has $2 trillion of paper to sell and the Fed has about $250 billion left to buy. That is nearly 10 to 1. And the market knows it.
The correlation between bond yields and the stock market is about to end. It is likely that this will be a protracted war that takes many months before a conclusion can be drawn. The first battle may take place this week. If the employment report is on the ‘good’ side then the bond market is going to take another hit. The stock market will certainly take notice if yields break toward 3.5%.
If the scenario painted by Mr. Kasman is the one that plays out over the next six months it will have to be coupled with a rise in bond yields back to the 4% of a year ago. Anything above that level will push mortgage rates back up to a level that re-starts the downward cycle. It is difficult to imagine how the ‘recovery’ can sustain itself for more than a few quarters if that is the case.
We are stuck between a rock and a hard place.


