"最好保值的黃金跌到$1000以下" (http://bbs.wenxuecity.com/inv-gold/389691.html),真的很想知道說這話的根據。沒有想到保值問題,但是黃金會跌到$1000的這種可能性,俺一直揮之不去,卻也找不到好的基本麵去支持這種可能性,很困惑不解。
1. 今天看了Martin Armstrong的這張圖示,
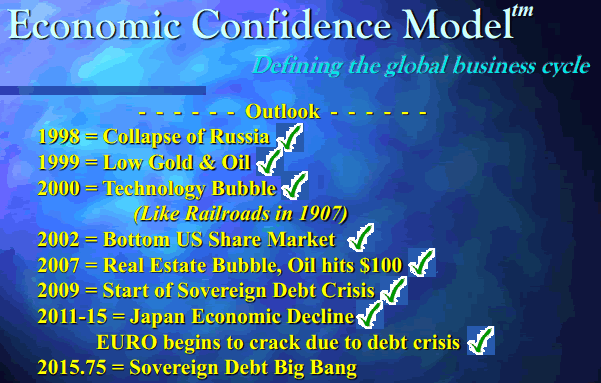
作者是這樣解讀這個圖示:
Why the hell would Gold drop towards $1,000 per ounce by 2015, while all the fundamentals are pointing to a “screaming buy”?
Well, if Martin Armstrong is correct and we would get a Sovereign Debt “Big Bang” sometime late 2015, then that could be the reason for Gold's drop. Sure, Debt Crises SHOULD be good for Gold, but even though the crisis in Europe is escalating, Gold is not acting as a “safe haven”. If the Debt crisis continues until 2015 (to reach a climax late 2015) and Gold continues to act the way it does right now, we could see Gold trade as low as $1,000 per ounce again.
2.再看看俺前幾天讀的一段文章說到:
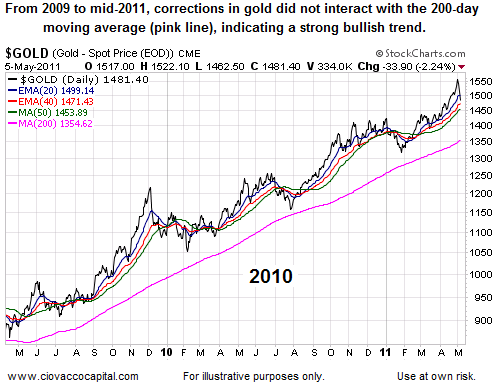
Gold is an excellent way to monitor investors'perception of how the battle between inflationary forces (money printing) and deflationary forces (purging debt) is playing out. In the chart below, investors were betting on the central bankers and inflation. The black line is the price of gold. The thin colored lines are moving averages, which are used to filter out the noise of day to day volatility. The chart below shows a strong trend and bias toward future inflation.
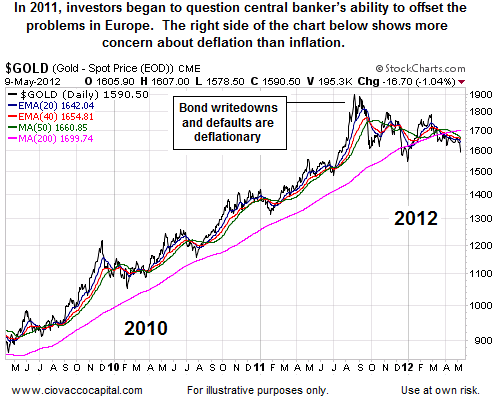
When Europe's enormous debt problems became the market's primary focus in mid-2011, investors began to realize how big, and how deflationary, the problem was. The right side of the chart below looks quite different than the left side. Notice on the left side, price never came back to the 200-day, nor did the "faster" moving averages ever cross the 200-day. The right side of the chart looks different and breaks the pattern of inflationary fears.
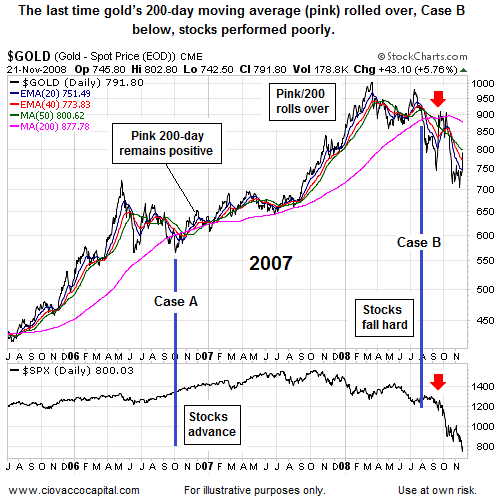
The chart below shows the last two times that (a) the price of gold broke below the 200-day MA and (b) some of the "faster" moving averages crossed below the 200-day. In Case A, the slope of gold's 200-day (pink) never rolled over in a negative manner. In Case A, stocks performed well after gold's bout of weakness (see bottom of chart in late 2006). In Case B, the slope of gold's 200-day did roll over in a bearish and deflationary manner. Stocks did not fare well (see red arrow lower right). As a reminder, gold's 200-day is trying to roll over in the present day, which looks more like Case B.
債務危機是黃金上漲的根本因素,但是在醞釀這個危機最終爆發的過程中,黃金不會上漲,甚至拉回,這是不是為黃金最終猛烈上漲積蓄力量?
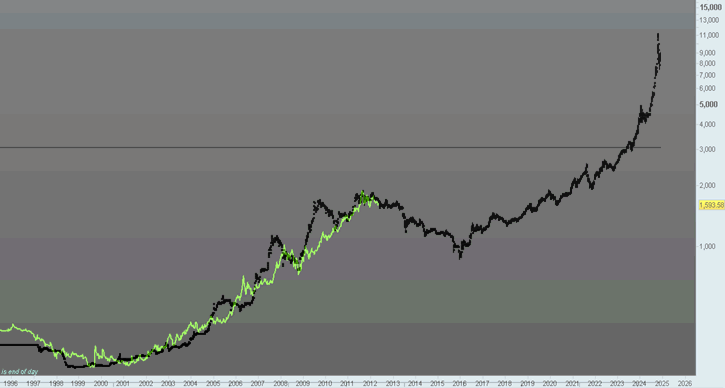
From the above chart, we could see Gold would drop towards $1,000 in 2015, before taking off to about $12,000 by 2025.
??????