智慧即財富
陳立功的文學城博客:馳縱騁橫,談今博古,飛花揚月,行文交友


科學家們起來反抗統計顯著性
(Scientists rise up against statistical significance)
(翻譯:Google Translate/陳立功)
Valentin Amrhein, Sander Greenland, Blake McShane and more than 800 signatories call for an end to hyped claims and the dismissal of possibly crucial effects.
Nature:20 MARCH 2019 Nature 567, 305-307 (2019); Picture Source: V. Amrhein et al.

When was the last time you heard a seminar speaker claim there was ‘no difference’ between two groups because the difference was ‘statistically non-significant’?
請問你最近一次在研討會上聽到有發言人稱“由於無統計顯著性,所以兩組之間沒有‘差異’”是什麽時候?
If your experience matches ours, there’s a good chance that this happened at the last talk you attended. We hope that at least someone in the audience was perplexed if, as frequently happens, a plot or table showed that there actually was a difference.
如果你和我們有過相似的經曆,那麽你很可能在上次參加的演講中遇到過這種會經常發生的事情。我們希望至少有一些聽眾會感到某種困惑:一個圖示或表格分明顯示存在著某種差異,為何被說成沒有呢?
How do statistics so often lead scientists to deny differences that those not educated in statistics can plainly see? For several generations, researchers have been warned that a statistically non-significant result does not ‘prove’ the null hypothesis (the hypothesis that there is no difference between groups or no effect of a treatment on some measured outcome)1. Nor do statistically significant results ‘prove’ some other hypothesis. Such misconceptions have famously warped the literature with overstated claims and, less famously, led to claims of conflicts between studies where none exists.
統計學如何引導科學家經常否認那些未經統計學教育的人能明白看到的差異?曆代統計學家一直在告誡應用研究者們,一個無統計顯著性的結果並不能“證明”無效假設(假設組間差異為零或治療對某測量結果無影響)1。有統計顯著性的結果也沒有“證明”某些其它假設。伴隨著某種誇大其詞的說法,這種誤解已經顯著地歪曲了文獻所報告的內容,還有一些則不那麽顯著地引發了不同研究結果之間不存在衝突的主張。
We have some proposals to keep scientists from falling prey to these misconceptions.
我們有一些建議讓科學家避免成為這些誤解的犧牲品。
Pervasive problem普遍存在的問題
Let’s be clear about what must stop: we should never conclude there is ‘no difference’ or ‘no association’ just because a P value is larger than a threshold such as 0.05 or, equivalently, because a confidence interval includes zero. Neither should we conclude that two studies conflict because one had a statistically significant result and the other did not. These errors waste research efforts and misinform policy decisions.
讓我們首先搞清楚必須停止什麽:我們永遠不應該僅僅由於P值大於0.05的閾值(或者等價地說,由於置信區間包括零)而得出“沒有差異”或“沒有關聯”的結論。如果一項研究結果有統計學意義而另一項沒有,我們也不應該因此就斷言它們之間存在著衝突。這樣的錯誤會浪費研究工作並誤導政策決策。
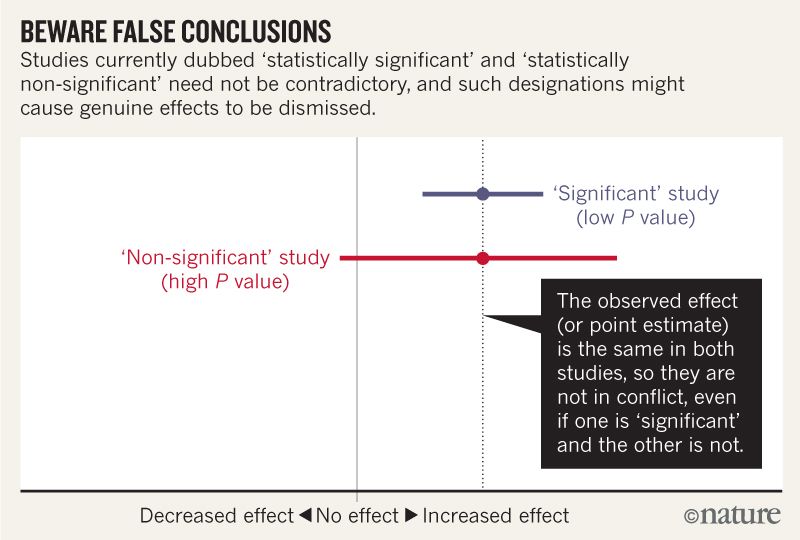
For example, consider a series of analyses of unintended effects of anti-inflammatory drugs2. Because their results were statistically non-significant, one set of researchers concluded that exposure to the drugs was “not associated” with new-onset atrial fibrillation (the most common disturbance to heart rhythm) and that the results stood in contrast to those from an earlier study with a statistically significant outcome.
例如,考慮對抗炎藥的副作用進行一係列分析2。因為它們的結果無統計顯著性,一組研究人員便得出結論,認為接觸這些藥物與新發房顫(最常見的心律紊亂)“無關”,這與早期有統計顯著性的研究結果相反。
Now, let’s look at the actual data. The researchers describing their statistically non-significant results found a risk ratio of 1.2 (that is, a 20% greater risk in exposed patients relative to unexposed ones). They also found a 95% confidence interval that spanned everything from a trifling risk decrease of 3% to a considerable risk increase of 48% (P = 0.091; our calculation). The researchers from the earlier, statistically significant, study found the exact same risk ratio of 1.2. That study was simply more precise, with an interval spanning from 9% to 33% greater risk (P = 0.0003; our calculation).
現在,讓我們看看實際數據。研究人員描述了其無統計顯著性的結果,發現風險比為1.2(即使用抗炎藥的人群相對於不使用者的風險增加20%),但95%的置信區間跨越了從微不足道的風險降低3%到相當大的風險增加48%(P = 0.091,我們的計算)。他們在其早期的一個同類研究數據中得到過完全相同的風險比1.2,以及一個更精確的風險區間:9%~33%(P = 0.0003,我們的計算)。
It is ludicrous to conclude that the statistically non-significant results showed “no association”, when the interval estimate included serious risk increases; it is equally absurd to claim these results were in contrast with the earlier results showing an identical observed effect. Yet these common practices show how reliance on thresholds of statistical significance can mislead us (see ‘Beware false conclusions’).
當區間估計包括嚴重的風險增加時,如果以統計上無顯著性就否認兩者之間的“關聯性”未免有點荒謬。如果認為這一結果與顯示相同觀察效果的早期結果形成了某種對立也同樣是荒謬的。然而,這些常見的做法表明,依賴統計顯著性的閾值會誤導我們(參見“謹防錯誤結論”)。
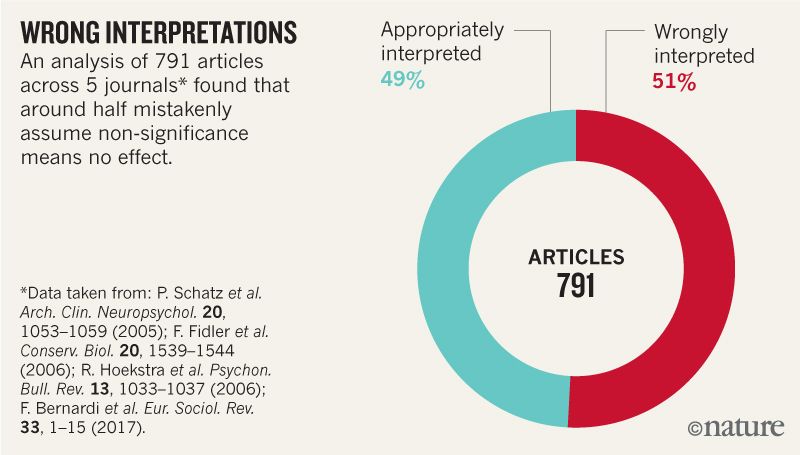
These and similar errors are widespread. Surveys of hundreds of articles have found that statistically non-significant results are interpreted as indicating ‘no difference’ or ‘no effect’ in around half (see ‘Wrong interpretations’ and Supplementary Information).
這些和類似的錯誤很普遍。對數百篇文章的調查發現,無統計顯著性的結果被解釋為“無差異”或“無影響”的約占一半(參見“錯誤的解釋”和補充信息)。
In 2016, the American Statistical Association released a statement in The American Statistician warning against the misuse of statistical significance and P values. The issue also included many commentaries on the subject. This month, a special issue in the same journal attempts to push these reforms further. It presents more than 40 papers on ‘Statistical inference in the 21st century: a world beyond P < 0.05’. The editors introduce the collection with the caution “don’t say ‘statistically significant’”3. Another article4 with dozens of signatories also calls on authors and journal editors to disavow those terms.
2016年,美國統計學會在《美國統計學家》上對濫用統計顯著性和P值發出警告。該問題還包括許多關於這一主題的評論。本月,該刊在其特刊上發表了40多篇關於“21世紀統計推斷:超越P <0.05的世界”的論文,試圖進一步推動這一改革。編輯們在介紹這一係列文章時,謹慎地表示“不要說‘有統計顯著性’”3。另有一篇文章以及數十個簽署者也呼籲作者們和期刊編輯應拒絕使用這些術語4。
We agree, and call for the entire concept of statistical significance to be abandoned.
我們同意,並呼籲放棄整個統計顯著性的概念。
We are far from alone. When we invited others to read a draft of this comment and sign their names if they concurred with our message, 250 did so within the first 24 hours. A week later, we had more than 800 signatories — all checked for an academic affiliation or other indication of present or past work in a field that depends on statistical modelling (see the list and final count of signatories in the Supplementary Information). These include statisticians, clinical and medical researchers, biologists and psychologists from more than 50 countries and across all continents except Antarctica. One advocate called it a “surgical strike against thoughtless testing of statistical significance” and “an opportunity to register your voice in favour of better scientific practices”.
我們不是在孤軍奮戰。當我們邀請其他人閱讀本評論的草稿並以簽名表示對我們的認可時,有250人在最初的24小時就簽了名。一周之後,簽名者達到800人 ---- 所有簽名者都確認了其屬於一個學術聯盟或表明其當前或過去的工作領域依賴於統計建模(參見補充信息中的簽名名單和最終統計),涉及50多個國家和除南極洲以外的所有大陸的統計學家、臨床和醫學研究人員、生物學家和心理學家。一位倡導者將其稱為“一次針對統計顯著性之輕率檢驗的外科手術”,以及“一次為更好的科學實踐發聲的機會”。
We are not calling for a ban on P values. Nor are we saying they cannot be used as a decision criterion in certain specialized applications (such as determining whether a manufacturing process meets some quality-control standard). And we are also not advocating for an anything-goes situation, in which weak evidence suddenly becomes credible. Rather, and in line with many others over the decades, we are calling for a stop to the use of P values in the conventional, dichotomous way — to decide whether a result refutes or supports a scientific hypothesis5.
我們並非要求禁用P值,既沒說它不能被用於某些特殊場合(例如確定製造過程是否符合某些質量控製標準)的決策標準,也沒有提倡可將弱證據突然變得可信這種無所事事的情形。相反,我們像幾十年來的許多其他人那樣,隻是呼籲停止以傳統的二分法決定結果是否反駁或支持科學假設的方式來使用P值5。
Quit categorizing退出(取消)分類化
The trouble is human and cognitive more than it is statistical: bucketing results into ‘statistically significant’ and ‘statistically non-significant’ makes people think that the items assigned in that way are categorically different6–8. The same problems are likely to arise under any proposed statistical alternative that involves dichotomization, whether frequentist, Bayesian or otherwise.
麻煩在於人類和認知而不是統計:將結果分為“統計上顯著”和“統計上不顯著”使人們認為以這種方式得到的是完全不同的分類結果6–8。無論是頻率主義者,還是貝葉斯學派,或者任何其流派,他們提出的任何涉及二分法的統計替代方案都可能產生同樣的問題。
Unfortunately, the false belief that crossing the threshold of statistical significance is enough to show that a result is ‘real’ has led scientists and journal editors to privilege such results, thereby distorting the literature. Statistically significant estimates are biased upwards in magnitude and potentially to a large degree, whereas statistically non-significant estimates are biased downwards in magnitude. Consequently, any discussion that focuses on estimates chosen for their significance will be biased. On top of this, the rigid focus on statistical significance encourages researchers to choose data and methods that yield statistical significance for some desired (or simply publishable) result, or that yield statistical non-significance for an undesired result, such as potential side effects of drugs — thereby invalidating conclusions.
不幸的是,一個錯誤的信念認為跨越了統計顯著性門檻能足以表明結果的“真實性”,這使得科學家和期刊編輯更鍾情於這樣的結果,從而扭曲了文獻。統計上顯著的估計值會幅度向上地產生大的偏差,且潛在地達到了很大的程度,而那些統計上不顯著的估計值則會幅度向下地存在偏差。因此,任何側重於其估計的顯著性的討論都會導致偏倚。除此之外,對統計顯著性的嚴格關注鼓勵著研究人員選擇數據和方法來獲得對某些期望的(或簡單可發表的)結果的統計學意義,或者對那些不希望的結果產生統計上的無意義,例如藥物潛在的副作用----從而使結論無效。
The pre-registration of studies and a commitment to publish all results of all analyses can do much to mitigate these issues. However, even results from pre-registered studies can be biased by decisions invariably left open in the analysis plan9. This occurs even with the best of intentions.
承諾預先登記研究並公布所有分析的全部結果可以大大減輕上述問題。然而,即使是預先登記的研究結果,也可能會因分析計劃中始終存在的某種意念而產生偏見9。即使有著最好的意圖,也會發生這種情況。
Again, we are not advocating a ban on P values, confidence intervals or other statistical measures — only that we should not treat them categorically. This includes dichotomization as statistically significant or not, as well as categorization based on other statistical measures such as Bayes factors.
同樣,我們並不主張禁止P值、置信區間或其它統計措施 ---- 我們隻是認為不應該區別有加地對待它們。這包括作為統計上顯著或不顯著的二分法,以及基於其它統計測量(例如貝葉斯因子)的分類。
One reason to avoid such ‘dichotomania’ is that all statistics, including P values and confidence intervals, naturally vary from study to study, and often do so to a surprising degree. In fact, random variation alone can easily lead to large disparities in P values, far beyond falling just to either side of the 0.05 threshold. For example, even if researchers could conduct two perfect replication studies of some genuine effect, each with 80% power (chance) of achieving P < 0.05, it would not be very surprising for one to obtain P < 0.01 and the other P > 0.30. Whether a P value is small or large, caution is warranted.
避免這種“二分法之癡迷”的一個理由是,所有的統計數據,包括P值和置信區間,在不同的研究之間自然會有所不同,並且通常會達到令人驚訝的程度。事實上,僅僅隨機變異就很容易導致很大的P值差異,遠遠超過0.05閾值的任何一側。例如,即使研究人員可以對一些真實效果進行兩次完美的重複性研究,每次都有80%的效能(機會)達到P<0.05,一個人獲得P<0.01而另一個P> 0.30就不足為奇了。無論P值是小還是大,都需要謹慎。
We must learn to embrace uncertainty. One practical way to do so is to rename confidence intervals as ‘compatibility intervals’ and interpret them in a way that avoids overconfidence. Specifically, we recommend that authors describe the practical implications of all values inside the interval, especially the observed effect (or point estimate) and the limits. In doing so, they should remember that all the values between the interval’s limits are reasonably compatible with the data, given the statistical assumptions used to compute the interval7,10. Therefore, singling out one particular value (such as the null value) in the interval as ‘shown’ makes no sense.
我們必須學會接受不確定性。一種實用的方法是將置信區間重命名為“兼容區間”,並以避免過度自信的方式解釋它們。具體而言,我們建議作者描述區間內所有值的實際含義,尤其是觀察到的效應(或點估計)和限製。與此同時,他們應該牢記,在給定用於計算區間的統計假設的情況下7,10,區間內的所有值都與數據合理地兼容。因此,在區間中挑出一個特定值(例如空值)為“顯示”是沒有意義的。
We’re frankly sick of seeing such nonsensical ‘proofs of the null’ and claims of non-association in presentations, research articles, reviews and instructional materials. An interval that contains the null value will often also contain non-null values of high practical importance. That said, if you deem all of the values inside the interval to be practically unimportant, you might then be able to say something like ‘our results are most compatible with no important effect’.
坦率地說,我們厭倦了在演示文稿、研究文章、評論和教學材料中看到的這種荒謬的“無效證明”和非關聯主張。一個無效值存在的區間通常還包含著具有高實用且重要的非無效值,也就是說,如果您認為一個區間內的所有值實際上並不重要,那麽您可能會說“我們的結果最兼容而沒有重要的效應”。
When talking about compatibility intervals, bear in mind four things. First, just because the interval gives the values most compatible with the data, given the assumptions, it doesn’t mean values outside it are incompatible; they are just less compatible. In fact, values just outside the interval do not differ substantively from those just inside the interval. It is thus wrong to claim that an interval shows all possible values.
在談論兼容區間時,請記住四件事。首先,僅僅因為在給定的假設下區間給出了與數據最相容的值,它並不意味著它之外的值是不相容的;它們隻是兼容性較差而已。實際上,區間之外的值與區間內的值沒有實質性差異。因此聲稱區間顯示了所有可能的值是錯誤的。
Second, not all values inside are equally compatible with the data, given the assumptions. The point estimate is the most compatible, and values near it are more compatible than those near the limits. This is why we urge authors to discuss the point estimate, even when they have a large P value or a wide interval, as well as discussing the limits of that interval. For example, the authors above could have written: ‘Like a previous study, our results suggest a 20% increase in risk of new-onset atrial fibrillation in patients given the anti-inflammatory drugs. Nonetheless, a risk difference ranging from a 3% decrease, a small negative association, to a 48% increase, a substantial positive association, is also reasonably compatible with our data, given our assumptions.’ Interpreting the point estimate, while acknowledging its uncertainty, will keep you from making false declarations of ‘no difference’, and from making overconfident claims.
其次,根據假設,區間內並非所有值都與數據同等兼容。點估計是最兼容的,其附近的值比接近極限的值更兼容。這就是為什麽我們敦促作者們討論點估計,即使它們具有較大的P值或較寬的區間,以及討論該區間的極限。例如,上述作者可能寫道:“與以前的研究一樣,我們的研究結果表明,給予抗炎藥物的患者新發房顫的風險增加了20%。盡管如此,根據我們的假設,風險差異從3%的減少,即小的負相關,到48%的增長,即實質性正相關,也與我們的數據合理地相容。”解釋點估計的同時承認其不確定性,可避免做出“無差異”的虛假聲明和過於自信的主張。
Third, like the 0.05 threshold from which it came, the default 95% used to compute intervals is itself an arbitrary convention. It is based on the false idea that there is a 95% chance that the computed interval itself contains the true value, coupled with the vague feeling that this is a basis for a confident decision. A different level can be justified, depending on the application. And, as in the anti-inflammatory-drugs example, interval estimates can perpetuate the problems of statistical significance when the dichotomization they impose is treated as a scientific standard.
第三,與它所來自的0.05閾值一樣,用於計算區間的默認95%本身就是一種任意(不是任意的,而是為了使得結果具有足夠的充分性,譯者注)約定。它基於一種錯誤(準確地說是一種可操作性,譯者注)觀點,即計算的區間本身有95%的可能性包含真值,再加上模糊的感覺,這是一個自信決定的基礎。根據應用,一個不同的水平是合理的。並且,如在抗炎藥物實例中,當它們施加的二分法被視為科學標準時,區間估計可以使統計顯著性的問題永久化。
Last, and most important of all, be humble: compatibility assessments hinge on the correctness of the statistical assumptions used to compute the interval. In practice, these assumptions are at best subject to considerable uncertainty7,8,10. Make these assumptions as clear as possible and test the ones you can, for example by plotting your data and by fitting alternative models, and then reporting all results.
最後,最重要的是要保持謙虛:兼容性評估取決於用於計算區間的統計假設的正確性。實際上,這些假設充其量都是不確定的7,8,10。應盡可能使假設得到清楚的表達和檢驗,如繪製數據並擬合替代模型,並報告所有結果。
Whatever the statistics show, it is fine to suggest reasons for your results, but discuss a range of potential explanations, not just favoured ones. Inferences should be scientific, and that goes far beyond the merely statistical. Factors such as background evidence, study design, data quality and understanding of underlying mechanisms are often more important than statistical measures such as P values or intervals.
無論統計數據顯示什麽,都可以找出有關結果的原因,但應討論一係列潛在的而不僅僅隻是有利的解釋。推論應該是科學的,且遠遠超出單純的統計範疇。背景證據、研究設計、數據質量和對潛在機製的理解等因素通常比統計測量(如P值或區間)更重要。
The objection we hear most against retiring statistical significance is that it is needed to make yes-or-no decisions. But for the choices often required in regulatory, policy and business environments, decisions based on the costs, benefits and likelihoods of all potential consequences always beat those made based solely on statistical significance. Moreover, for decisions about whether to pursue a research idea further, there is no simple connection between a P value and the probable results of subsequent studies.
我們聽到的反對不再使用統計顯著性的意見是因為需要作出是或否的決定。但對於監管、政策和商業環境中經常所需的抉擇,基於所有潛在後果的成本、收益和可能性的決策總是優於單純基於統計顯著性的決策。此外,對於是否進一步追求研究思想的決定,P值與後續研究的可能結果之間沒有簡單的聯係。
What will retiring statistical significance look like? We hope that methods sections and data tabulation will be more detailed and nuanced. Authors will emphasize their estimates and the uncertainty in them — for example, by explicitly discussing the lower and upper limits of their intervals. They will not rely on significance tests. When P values are reported, they will be given with sensible precision (for example, P = 0.021 or P = 0.13) — without adornments such as stars or letters to denote statistical significance and not as binary inequalities (P< 0.05 or P> 0.05). Decisions to interpret or to publish results will not be based on statistical thresholds. People will spend less time with statistical software, and more time thinking.
不再使用統計顯著性後會變成什麽情形?我們希望方法部分和數據列表更加詳盡和細致。作者將強調他們的估計結果以及其中的不確定性 ---- 例如,明確討論它們的區間的下限和上限。他們不會依賴顯著性檢驗。當報告P值時,它們將以合理的精度給出(例如,P = 0.021或P = 0.13)---- 沒有星形或字母等裝飾來表示統計顯著性,也不是二元不等式(P <0.05或P> 0.05)的形式)。解釋或發布結果的決定不會基於統計閾值。人們花在統計軟件上的時間會更少,而是用更多的時間去思考。
Our call to retire statistical significance and to use confidence intervals as compatibility intervals is not a panacea. Although it will eliminate many bad practices, it could well introduce new ones. Thus, monitoring the literature for statistical abuses should be an ongoing priority for the scientific community. But eradicating categorization will help to halt overconfident claims, unwarranted declarations of ‘no difference’ and absurd statements about ‘replication failure’ when the results from the original and replication studies are highly compatible. The misuse of statistical significance has done much harm to the scientific community and those who rely on scientific advice. P values, intervals and other statistical measures all have their place, but it’s time for statistical significance to go.
我們要求不再使用統計顯著性,並將置信區間理解為兼容區間並不是一劑靈丹妙藥。雖然它會消除許多不良做法,但也很可能導致新的不良後果。因此,監測文獻中的統計濫用應該是科學界一個持續的優先事項。但是,當原始和重複研究的結果高度兼容時,根除分類將有助於避免過度自信的主張,無擔保的“無差異”聲明以及關於“重複失敗”的荒謬聲明。濫用統計意義對科學界和依賴科學建議的人造成了很大的傷害。P值、區間和其它統計測量都有它們的位置,但現在是與統計顯著性告別的時候了。
References
1. Fisher, R. A. Nature 136, 474 (1935). Article Google Scholar
2. Schmidt, M. & Rothman, K. J. Int. J. Cardiol. 177, 1089–1090 (2014). PubMed Article Google Scholar
3. Wasserstein, R. L., Schirm, A. & Lazar, N. A. Am. Stat. https://doi.org/10.1080/00031305.2019.1583913 (2019). Article Google Scholar
4. Hurlbert, S. H., Levine, R. A. & Utts, J. Am. Stat. https://doi.org/10.1080/00031305.2018.1543616 (2019). Article Google Scholar
5. Lehmann, E. L. Testing Statistical Hypotheses 2nd edn 70–71 (Springer, 1986).
6. Gigerenzer, G. Adv. Meth. Pract. Psychol. Sci. 1, 198–218 (2018). Article Google Scholar
7. Greenland, S. Am. J. Epidemiol. 186, 639–645 (2017). PubMed Article Google Scholar
8. McShane, B. B., Gal, D., Gelman, A., Robert, C. & Tackett, J. L. Am. Stat.
https://doi.org/10.1080/00031305.2018.1527253 (2019). Article Google Scholar
9. Gelman, A. & Loken, E. Am. Sci. 102, 460–465 (2014). Article Google Scholar
10. Amrhein, V., Trafimow, D. & Greenland, S. Am. Stat. https://doi.org/10.1080/00031305.2018.1543137 (2019). Article Google Scholar Download references

以科學的名義行偽科學之實 自古有之。可以理解原文所表達的統計顯著概念被濫用,被誤導,被簡單化,甚至被政治化。
要點還在於正確理解科學概念,科普而不是反科普。
雖然很多情況下統計學差異是否有顯著性是理論上的東西,要不要沒有什麽實際意義,但是也有不少情況下顯著性被作為一個標準用,譬如說測試新藥的臨床試驗,如果沒有顯著性的話,那就沒有一個具體的標準了。