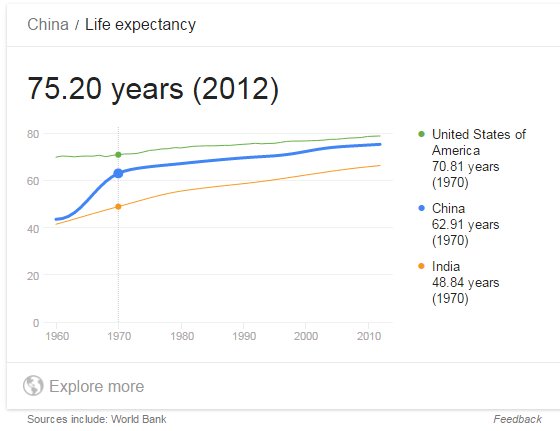
I happened come across this images. Using US and India as "upper and lower" range, China data moved away from lower range and moved up quickly 1960-1970, then slowly approaching the upper limit.
I happened come across this images. Using US and India as "upper and lower" range, China data moved away from lower range and moved up quickly 1960-1970, then slowly approaching the upper limit.
•
嗬嗬,暗無天日的文革時期。
-Ownthought-
♂
![]() (0 bytes)
()
05/09/2016 postreply
19:00:37
(0 bytes)
()
05/09/2016 postreply
19:00:37
•
這圖是俺重新審視文革的主要原因。
-hillhawkus-
♂
![]()
![]() (169 bytes)
()
05/09/2016 postreply
23:25:31
(169 bytes)
()
05/09/2016 postreply
23:25:31
•
文革時赤腳醫生的功勞是很大的。赤腳醫生是文革前就出現了,不是文革的產物,但是在文革中蓬勃發展。
-墨遊-
♂
![]()
![]() (0 bytes)
()
05/10/2016 postreply
07:59:23
(0 bytes)
()
05/10/2016 postreply
07:59:23
•
樓上的沒搞錯把,從圖中可以看出,文革是個拐點,由快速上升變為較緩慢的上升。純數學討論。。。
-老農民說兩句-
♂
![]()
![]() (0 bytes)
()
05/10/2016 postreply
21:06:52
(0 bytes)
()
05/10/2016 postreply
21:06:52
•
不拐又會怎樣?難不成直線上升到300歲?怎一個數學呆子。是什麽樣的心態使你麵對事實,卻又不願承認現實?反文革,那是貪官們的必須!
-怒可遏-
♀
![]() (197 bytes)
()
05/11/2016 postreply
00:44:38
(197 bytes)
()
05/11/2016 postreply
00:44:38
•
那改開後怎麽還是較緩慢的上升?
-williamsteng-
♂
![]() (0 bytes)
()
05/11/2016 postreply
22:54:47
(0 bytes)
()
05/11/2016 postreply
22:54:47
•
如果把醫療投入再畫一張圖放一起就更有趣了。
-shamrock100-
♀
![]()
![]() (0 bytes)
()
05/11/2016 postreply
12:37:52
(0 bytes)
()
05/11/2016 postreply
12:37:52
•
槍在誰手,曆史就是誰說了算
-syttjl-
♂
![]() (42 bytes)
()
05/12/2016 postreply
23:13:52
(42 bytes)
()
05/12/2016 postreply
23:13:52
WENXUECITY.COM does not represent or guarantee the truthfulness, accuracy, or reliability of any of communications posted by other users.
Copyright ©1998-2025 wenxuecity.com All rights reserved. Privacy Statement & Terms of Use & User Privacy Protection Policy