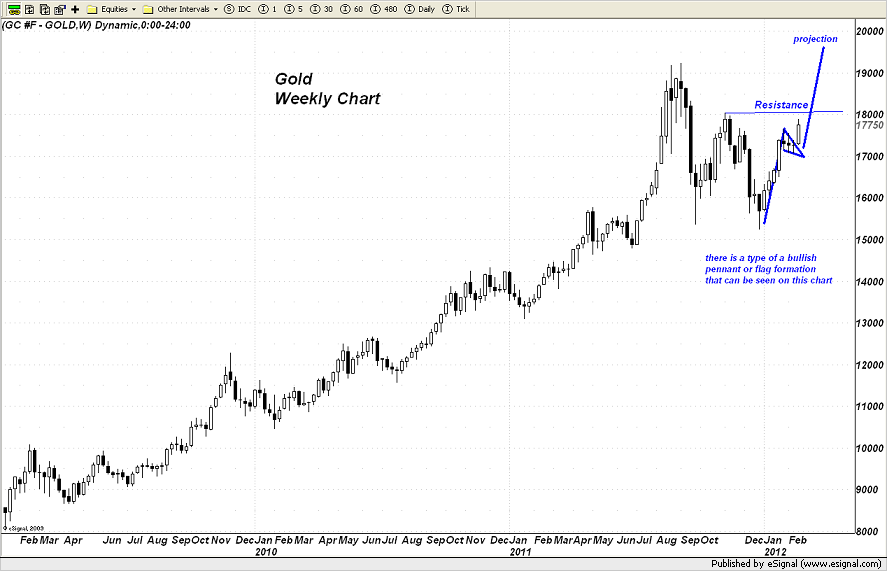
Dan Norcini短期金價預測:1955-1995:

quote:If you notice the pattern I have marked as a "bullish pennant" or a "bullish flag" you will see the flagpole and the pennant or actual flag. These patterns occur often enough that they should be noted as they generally portend a strong move in the direction of the flagpole which can be used as a gauge of where price might be expected to run in the near future. The length of this flagpole which extends from the bottom near $1535 to the top of the pole coming in near 1765 is $230.
Once you get a brief period of consolidation, which is exactly what we have had the last three weeks prior to this one just completed, a fresh upside move which takes out the HIGH OF THE FLAGPOLE then gives us the potential for a move of some $230 higher. Some technicians will add this to the top of the flagpole giving a projection of $1995. Others whom are a bit more conservative (put me in that category) will add the length of the flagpole to the BREAKOUT POINT of the downtrending line forming the top of the flag. That price point came in near $1725 which yields a projection of $1955. Either way it gives us gold at a brand new all time high. http://traderdannorcini.blogspot.co.nz/2012/02/strong-weekly-close-in-gold.html