LOL's Trading room
stay cool, play cool, you will be really coolAlthough the market had another bad week there are some indications we could see a bottom develop before much longer. In the past when the 3 week average of Bearish Advisor Sentiment has exceeded 35% (points A) this has been followed by an oversold bounce of varying magnitudes within a week or two (points B to C). This week the 3 week average of Bearish Advisor Sentiment rose above the 35% level (point D) so this could be a signal of a nearing oversold bounce. The last time the Bearish Advisor Sentiment rose above 35% was in early March (point E) which was followed by a 13% rally in the S&P 500 from mid March through early May (points F to G). 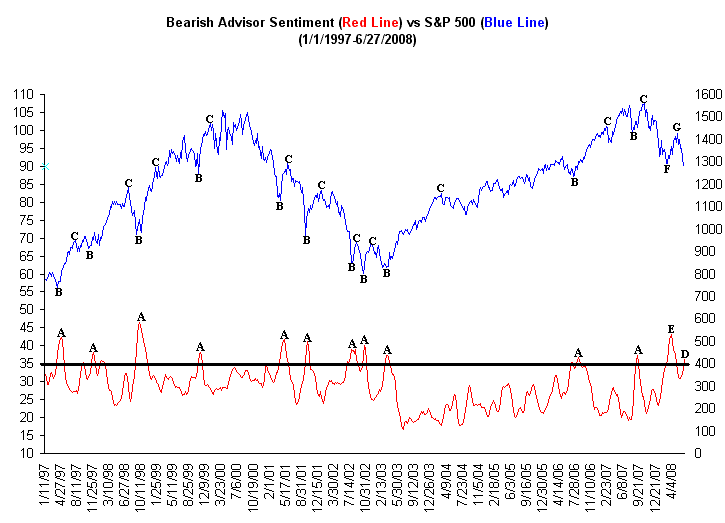
Meanwhile the price of Crude Oil is attempting to make a second breakout attempt from its 3 week trading range which has pressured the market. The question is will the price of Crude Oil follow through or will it have another failed breakout attempt like occurred a few weeks back (point I). If the price of Crude Oil is able to follow through to the upside in the near term this will likely lead to more selling pressure in the market. However if the price of Crude Oil fails to follow through a second time then we could see it drop back to the 132 area which is where it has been finding support at the past few weeks. If this were to occur then we could see an oversold rally develop in the major averages. 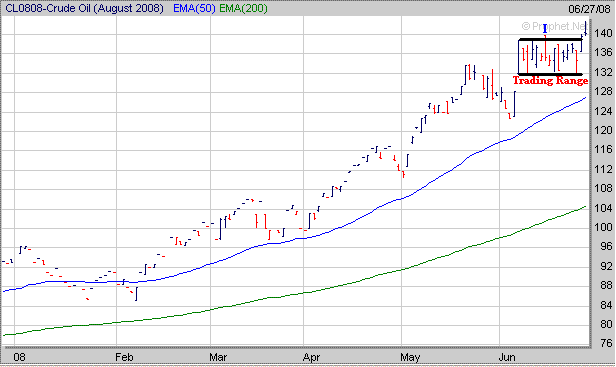
As far as the major averages the Dow broke below a key longer term support level this week near 11525 which coincided with its 38.2% Retracement Level calculated from the October 2002 low to the October 2007 high. From a longer term perspective this is a very bearish development as the next major support level for the Dow would either be at its 50% Retracement Level near 10700 (point J) or at its 61.8% Retracement Level near 9875 (point K). Keep in mind before these levels are reached more than likely we will see at least one significant oversold bounce occur before these levels are tested in the longer term. 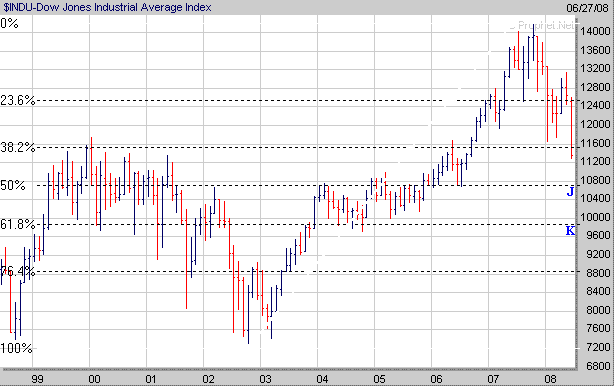
The Nasdaq dropped just below its 61.8% Retracement Level this week (calculated from the March low to the early June high) near 2310 and if an oversold bounce develops in the near term look for initial upside resistance to occur near 2415 which is at its 20 Day EMA (blue line) and newly developed downward sloping trend line (black line) from the early June high. Meanwhile in the longer term once any oversold bounce ends it抯 likely the Nasdaq may eventually retest its mid March low near 2160 (point L). 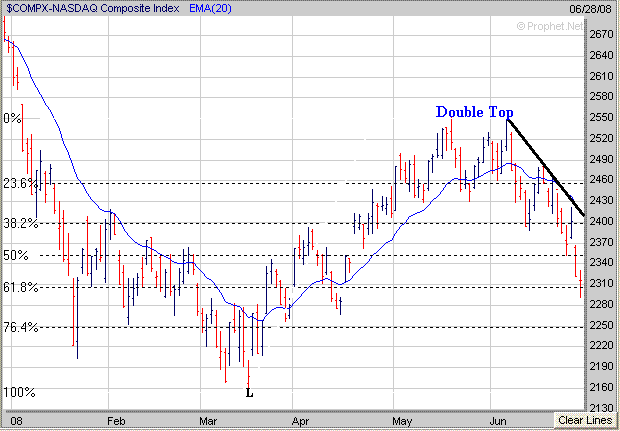
As far as the S&P 500 in the short term if it can hold support at or above its mid March low near 1260 and undergoes an oversold bounce look for upside resistance to occur either at its 20 Day EMA (blue line) near 1340 or along its newly developed downward sloping trend line (black line) around 1350.
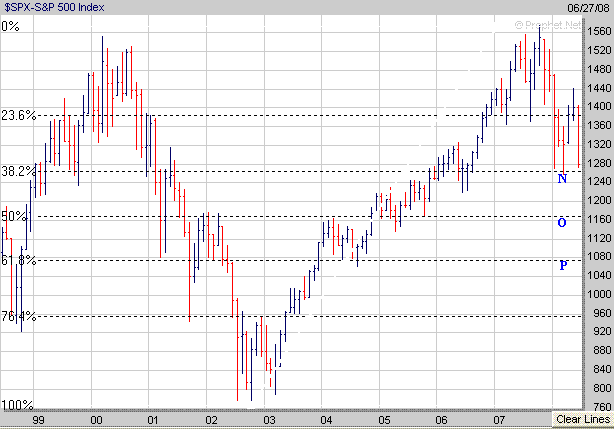
Meanwhile in the longer term you can see the 1260 level (point N) is a key support area for the S&P 500 which corresponds to its 38.2% Retracement Level (calculated from the October 2002 low to the October 2007 high) and the mid March low. If the S&P 500 were to break solidly below the 1260 level its next level of support would either be at its 50% Retracement Level near 1170 (point O) or at its 61.8% Retracement Level around 1075 (point P). 