LOL's Trading room
stay cool, play cool, you will be really cool
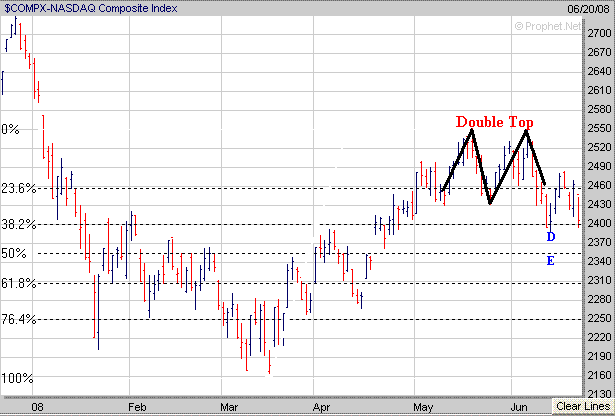
The Nasdaq so far has been holding up much better than the Dow and has fallen just over 6% since completing a Double Top pattern in earlier this month. If the Nasdaq fails to hold support near the 2388 (point D) level early next week then look for its next level of support at its 50% Retracement Level (calculated from the mid March low to the early June high) around 2355 (point E).

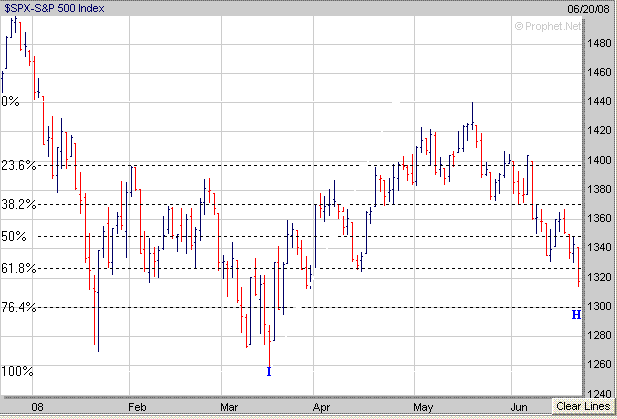
As far as the S&P 500 it failed to hold support at its 61.8% Retracement Level on Friday near 1326 (calculated from the mid March low to the May high). The next area of support for the S&P 500 would be at its 76.4% Retracement Level at 1300 (point H). If an oversold bounce doesn't occur at the 1300 level then the next level of support would be at the mid March low near 1260 (point I). 
The price of Crude Oil attempted to break out of its consolidation pattern on Monday but then dropped back into its trading the rest of the week which has been basically between 132 and 139 the past few weeks. Eventually the price of Crude Oil is going to break out of this trading range and make a substantial move in one direction or the other. If the price of Crude Oil breaks out to the upside and makes a substantial move higher that will likely lead to more selling pressure in the market. On the other hand if the price of Crude Oil were to break to the downside instead and drop back to its 50 Day EMA (blue line) in the mid 120's then we could see a decent oversold rally develop.


