LOL's Trading room
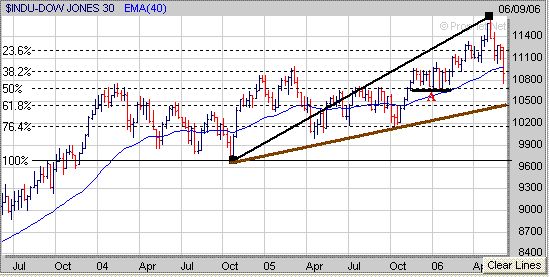
stay cool, play cool, you will be really coolThe major averages have been in a correction during the past five weeks. The Dow has dropped around 900 points or 7.8% since peaking in early May and failed to hold support at its 40 Weekly EMA (blue line) this week. If the Dow remains under more selling pressure the next area of support appears to be at its 50% Retracement Level (calculated from the October 2004 low to its most recent high) near 10700. The 10700 level is also where the Dow found support at in the late part of 2005 into the early part of 2006 as well (point A). If the Dow fails to hold support at the 10700 level then the next downside support area would be just below 10500 which corresponds to its 61.8% Retracement Level and upward sloping trend line (brown line) originating from the October 2004 low.
Meanwhile if the Dow attempts to bounce from oversold conditions next week look for its first level of resistance in the 11000 to 11200 range. The 11000 area is where the Dow's falling 20 Day EMA (blue line) is nearing and is also where the 38.2% Retracement Level (calculated from the early May high to the most recent low) is close to as well. Meanwhile the 11200 area is where the Dow's 50 Day EMA (green line) resides at and is also near its 50% Retracement Level.
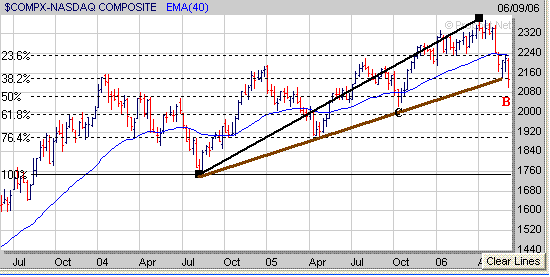
The Nasdaq has fallen around 275 points or 11.6% since peaking in early April and broke below a key longer term support level this week near the 2135 area. The 2135 area corresponded to the Nasdaq's 38.2% Retracement Level (calculated from the August 2004 low to the April 2006 high) and also was along its upward sloping trend line (brown line) originating from the August 2004 low as well. If the Nasdaq remains under more selling pressure its next level of support would either be at its 50% Retracement Level near 2060 (point B) or at its October 2005 low near 2030 (point C). 
Meanwhile if the Nasdaq attempts to rally next week from oversold conditions look for initial resistance to occur in the 2195 to 2205 area. The 2195 area is where the Nasdaq's falling 20 Day EMA (blue line) resides at while the 2205 level is where its 38.2% Retracement Level (calculated from the April high to the most recent low) comes into play at. If the Nasdaq were to rise above the 2205 level then look for even stronger resistance at its 200 Day EMA (purple line) near 2225.
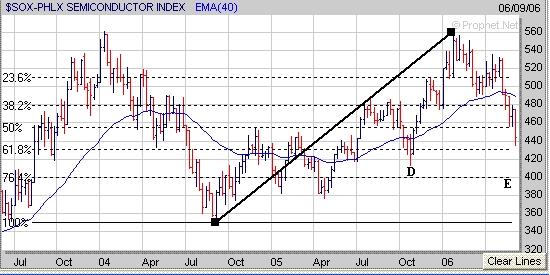
One reason the Nasdaq has been clobbered of late is due to the weakness in the Semiconductors. The Semiconductor Index (SOX) continues to act very poorly and is now approaching a key support level near the 430 area which corresponds to its 61.8% Retracement Level (calculated from the September 2004 low to the January 2006 high). If the SOX fails to hold support near the 430 level then look for it to eventually drop back to either its October 2005 low near 410 (point D) or its 76.4% Retracement Level near 400 (point E). As long as the SOX remains under selling pressure the Nasdaq is likely going to trend lower as well. Thus I think next week will be a crucial week for the SOX as it must hold support near the 430 level. 
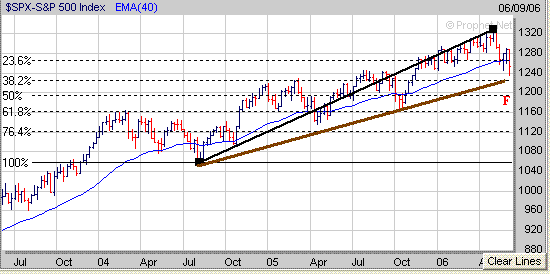
As far as the S&P 500 it has fallen around 90 points or 7% the past five weeks and also has broken below its 40 Weekly EMA (blue line). However so far the S&P 500 has held support above the 1230 level which is an important longer term support area that coincides with its upward sloping trend line (brown line) originating from the August 2004 low and its 38.2% Retracement Level (calculated from the August 2004 low to the most recent high). Thus it's going to be important for the S&P 500 to hold support near the1230 level over the next few weeks. If the S&P 500 were to break below the 1230 level then its next area of support would be at its 50% Retracement Level just below the 1200 level (point F). 
Meanwhile if the S&P 500 can hold support at or above the 1230 level and then begins to rally from oversold conditions look for initial resistance in the 1270 to 1272 range. The 1270 area is at the S&P 500's 38.2% Retracement Level (calculated from the early May high to the most recent low) while the 1272 level is at its falling 20 Day EMA (blue line). If the S&P 500 were able to rise above the 1272 area look for even stronger resistance to occur in the 1280 to 1283 range. The 1280 level is at the S&P 500's 50% Retracement Level while the 1283 area corresponds to its 50 Day EMA (green line).


