股市小書生
價值投資


先說廢話:
我們交流的投資邏輯,相互學習的也隻是投資邏輯。雖然我們涉及一些具體的實例,但是目的都是為了闡述其背後的投資邏輯,我認為一個理智成熟的人應該會主動的理解這一點。有些人認為我現在談股指,加國銀行股就是鼓吹在最高價買入股指和加國銀行股,我請求這樣的人不要閱讀我的帖子,因為你沒有能力理解我要闡述的投資邏輯,沒有必要浪費時間,而且因為你無法正確理解,所以即使我的投資邏輯是“無毒”的,你也會主動的把它變成“有毒”的,因此我再次請求你不要閱讀我的帖子。
下麵有一個猛牛的帖子,因為他提到了一個我很感興趣的東西 “紅利”,我想談談我的一些學習體會。
---------------------------------------------------------------------------------------------------------------
猛牛:
本來看他是俺同一戰壕裏的戰友,要愛護小戰友,不批評他,結果他越來越離譜,什麽“每個月的15號是大多數加國地產基金交租(發紅利)的日子,看著比自己薪水高幾倍的現金每月準確無誤的到賬,是一種享受。”都來了。
就算我“清理門戶“ 好了。讓地主們見笑了。
見諒!
另外,投資股票的股友,如果你還年輕,千萬不要聽他忽悠賣分紅股票,買分紅股票是
錢多或上了歲數的人士保守投資(但比債卷風險大些),屬於獲得穩定收入的投資範疇。
----------------------------------------------------------------------------------------------------------------
"Do you know the only thing that gives me pleasure? It's to see my dividends coming in."
- John D. Rockefeller
“每個月的十五號是我每個月最高興的一天,因為那是我每個月收到紅利最多的一天。” - 股市小書生
“每個月收到房租的時候是我最開心的一刻。” - 老朽 (朽哥,是這麽個意思吧?)
“ The prime purpose of a business corporation is to pay dividends regularly and, presumably, to increase the rate as time goes on.”
— Benjamin Graham, Security Analysis, 1934
加國五大銀行在一百多年時間,從不間斷向股東支付紅利,並且以大於通脹的幅度增加紅利,
所以加國銀行符合Benjamin Graham對企業的基本定義。
再說幾句廢話,我學習的是已經被Benjamin Graham帶入墳墓的最陳舊的投資基礎理論,沒有任何的“新玩意”,想追“新玩意”的人,請忽略我的帖子。
下麵是一些網絡文章摘選:
Dividends are an important form of return to equity investors, and have become one of the most researched topics in capital markets. The popularity of dividend-paying stocks is high, and for good reason: dividends can be a significant contributor to superior long-term investment results.
This general finding has been documented over various timeframes and markets. For example, one study examines the components of total equity returns of US stocks from 1802 to 2002. Over the 200-year period, dividends (plus real growth in dividends) accounted for fully 5.8% of the 7.9% total annualized returni. Another study examines the subject from a global perspective. Researchers at the London Business School found that, from 1900 to 2005, the real return across 17 countries averaged approximately 5%, while the average dividend yield of those countries during the period was 4.5%ii.
The Returns Data
This paper utilizes data from Kenneth French, based on original stock data from the US Stock Database©2014 Center for Research in Security Prices (CRSP), the University of Chicago Booth School of Business and includes all equity securities listed on NYSE, Amex, NASDAQ and NYSE Arca during the time period. We utilized monthly and annual value-weighted total returns of non-dividendpaying
US stocks and five portfolios of dividend-paying stocks from 1928 through 2013. The five dividend-paying portfolios are constructed using quintiles of the dividend-to-price ratio (dividend yield), with quintile 1 representing the lowest-yielding dividend payers and quintile 5 representing the highest. Portfolios were formed and rebalanced annually.
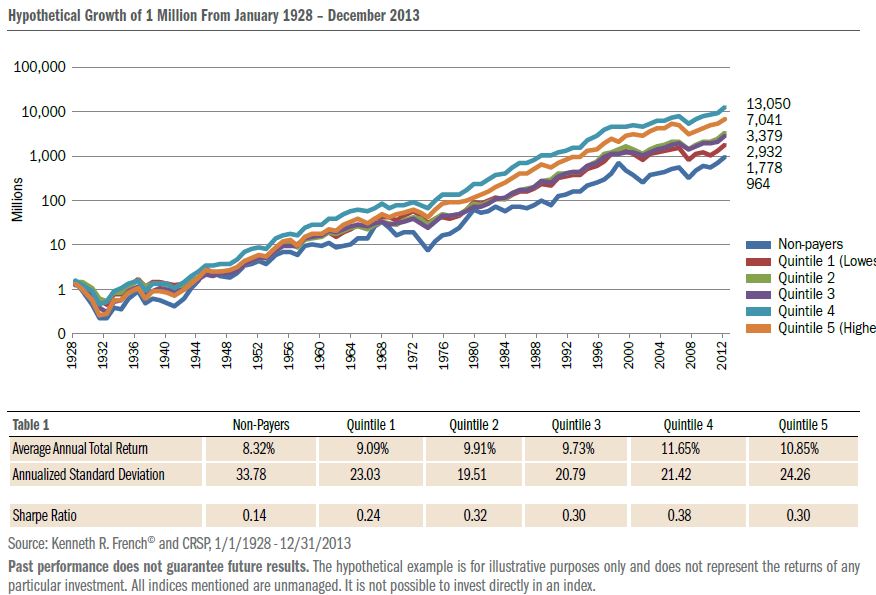
The Long Term
The chart below shows how an investment in each portfolio as of January 1928 would have grown through December 2013, with dividends reinvested. Over the full period, all portfolios of dividend payers outperformed the portfolio of non-dividend payers. Other features are important to highlight. Generally, higher dividend-yielding quintiles outperformed lower-yielding quintiles. As shown in Table 1, the volatility of the dividend payers, as measured by annualized standard deviation, was ignificantly lower than that of the non-payers. This is evident in the relatively higher Sharpe ratios of the dividend payers.
20-Year Horizons
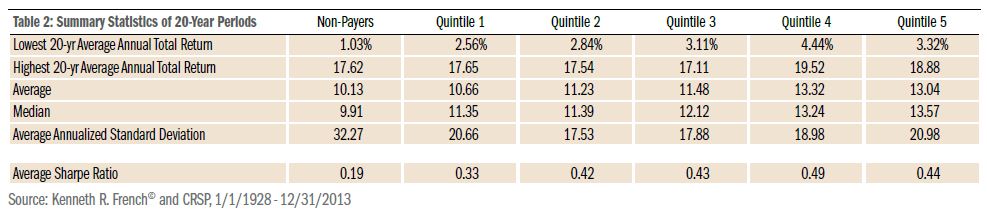
Many investors have an investment horizon shorter than our sample illustrates. Furthermore, within the past 86 years, markets have gone through several boom and bust cycles. No doubt, the timing of investment can be critical to an investor’s ultimate fortunes. In this section, we measure how dividend-paying stocks have performed across various holding periods. Arbitrarily, we have chosen to measure performance across 20-year periods, a realistic time frame for most long-term investors.
In the full dataset there have been 67 periods of 20 consecutive calendar years. Table 2 on the following page shows how the six portfolios stack up on annualized returns and standard deviations over the 20-year periods. Similar to the full 86-year sample, we find a direct relationship between dividend yield and total return. And again, volatility for dividend-paying portfolios was lower than that of non-payers.
Performance in Down Markets
To identify “down markets,” we utilized monthly data from a CRSP dataset that contained a market” return from January 1928 through December 2013. We believe this series is the best available representation of a broad U.S. market return, and used it to determine all periods in which the market declined a cumulative 10% or more (a common definition for a market correction) in onsecutive negative months. We then calculated the cumulative returns of the six portfolios for the same months the market was in a correction. There were 46 market corrections during the period (11 corrections occurred during the past 20 years). Of these 46 periods, duration ranged from one month to seven consecutive months of negative monthly returns. Because of the wide range of severities
of these drawdowns—ranging from -10% to -42%—we’ve summarized the results in Table 5.
These findings summarize the downside protection that dividend payers have historically provided during down markets. The relative advantage over non-dividend payers was larger in more moderate drawdowns. But even during severe drawdowns each quintile of dividend payers substantially outperformed non-dividend payers. In another study, the Wall Street Journal cited market performance during 1981-1982, 1990, 2000-2002, and 2008, finding that dividend payers as a whole outperformed non-payers during the market routs of those yearsiii. These findings offer evidence to support the claim that the results generated from the full 86-year sample are in accordance with modern market history. Downside protection is meaningful to most investors due mainly to the speed and intensity of corrections (28 out of the 46 corrections in our sample were finished in three months or less). Many institutions are not able to reallocate a portfolio quickly in the midst of a downturn due to size and rigidity of decision-making processes. Most non-professional investors may lack the real-time market knowledge or the necessary tools to act quickly. A strong case can thus be made for maintaining a strategic allocation to dividend-paying stocks, if only on the grounds of risk management.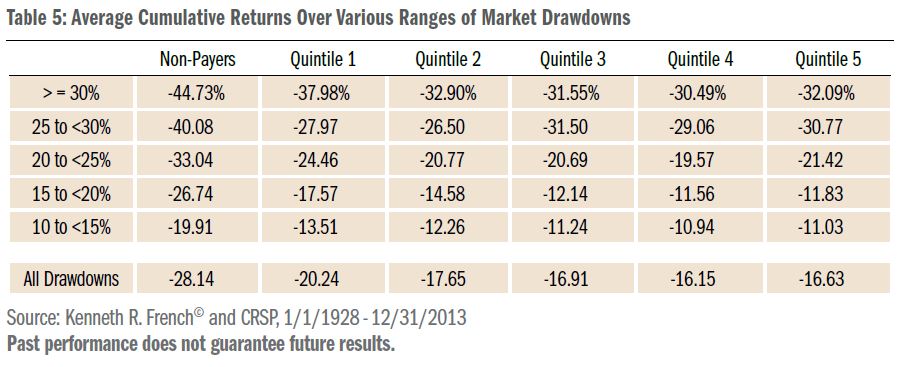
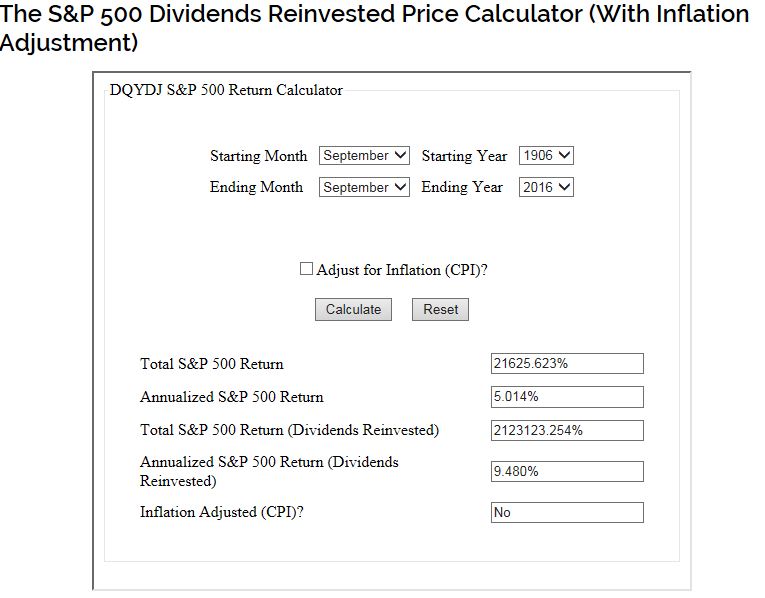
過去一百年,美國市場的整體回報中紅利和紅利複利再投資占99%。
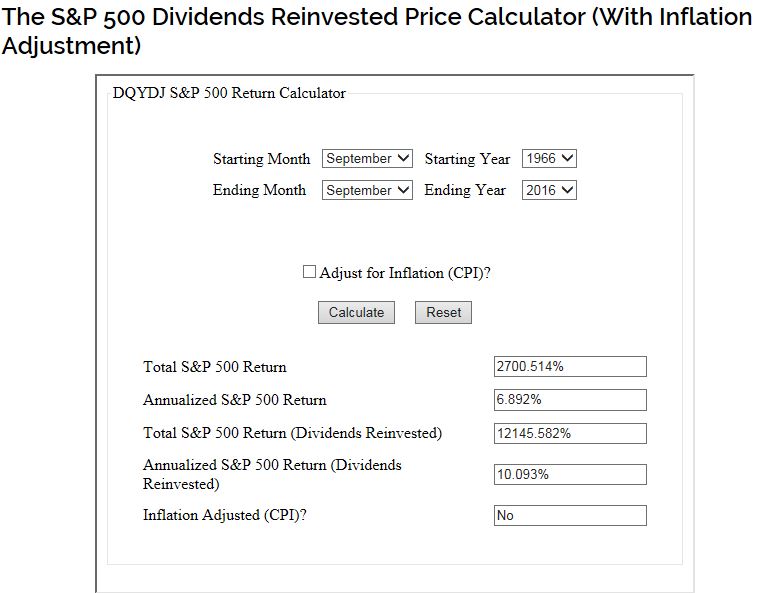
過去五十年,美國市場的整體回報中紅利和紅利複利再投資占78%。
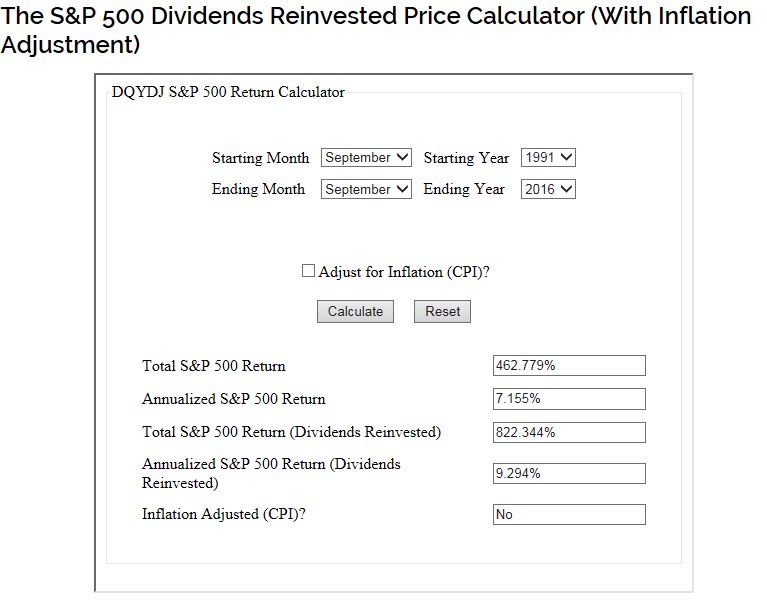
過去二十年,美國市場的整體回報中紅利和紅利複利再投資占45%。
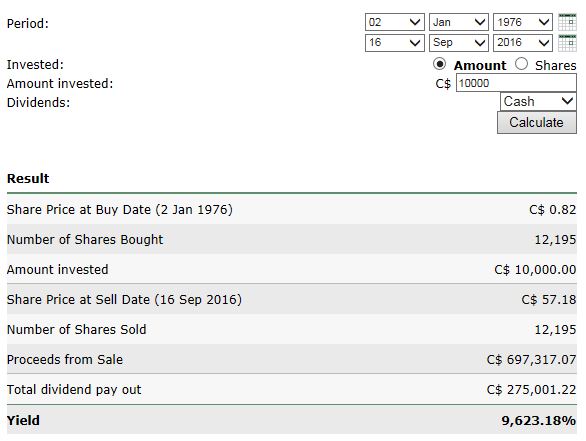
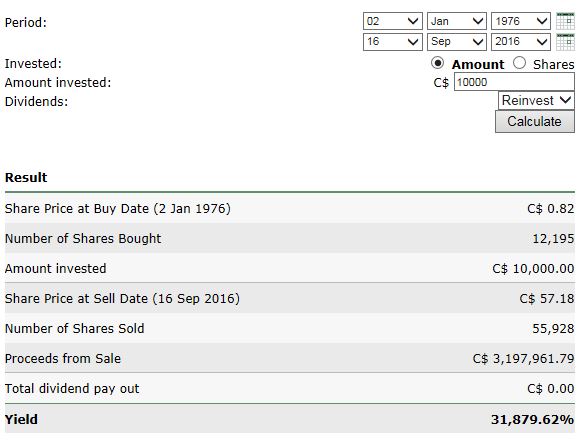
過去四十年,TD的整體回報中紅利和紅利複利再投入占78%。
在長期投資中, 如果你忽略紅利和紅利的複利再投入,你就忽略了市場整體回報中的絕大多數利潤。當你的整體投資組合偏向於非紅利股,你選擇了更高難度的投資方式,而你的回報可能是更低。當你的整體投資組合偏向於紅利股,你選擇了最低難度的投資方式,而你的回報可能是最高的。這裏說的是一個基本理論概念。
所以對像猛牛一樣,在股市中選擇高難度,低回報的投資者,我要對他們說:
“兄弟,您辛苦,您受累。挑戰高難度,悠著點,別散了腰。”