正文
Assuming the best but getting the worst
Dear iTulip,
So I'm reading my favorite financial news source Yahoo! Finance and come across this article Your House: Breaking the Bank that says:
I have nearly all of my retirement money sunk into my house and I planto retire in a few years. How will I retire? Houses are not selling inmy area and I have no other source of retirement money. All of myfriends are in the same position. I bet my problem is common. What doesthis mean for the economy?
Signed,
Cornered in California
Dear Cornered,
The bad news is you have indeed been duped into putting far too much ofyour savings into your home. The good news is... you are not alone!
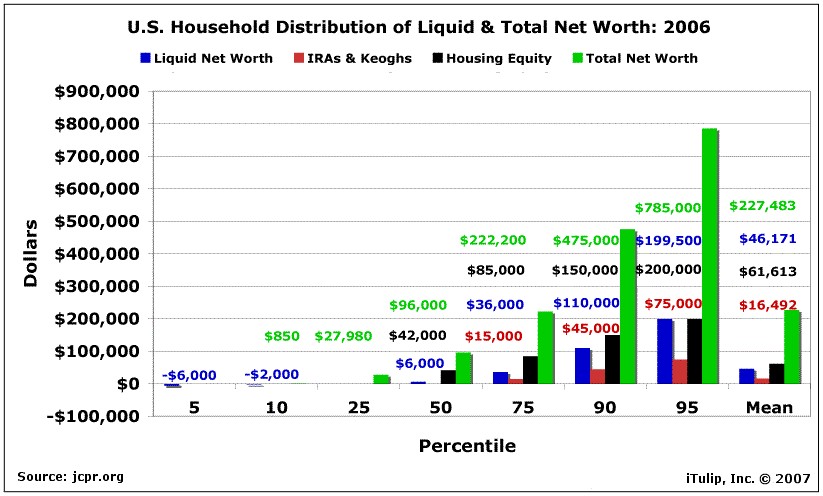
Over the years you've probably read dozens of articles extolling thegreat rise in household wealth in the U.S. over the past 20 years. Wedeveloped this chart in our article about USA, Inc.to show just where the all that much touted household net worth islocated on the household balance sheet, along with who has it and whodoesn't, and how much of that is liquid–that is, can actually be spent,versus how much is tied up in an asset that must be sold or put up ascollateral for a loan before the owner has cash to spend.

As you can see, only the top percentiles have much in the way of totalnet worth. The mean level of total net worth is $227,000. Of that, only$46,000 is liquid, with $62,000 tied up in real estate and only $16,000invested in IRAs and Keochs. Real estate makes up the majority of networth all the way up to the 90th percentile. Only when you reach the95th percentile do you see home equity merely equal to liquid networth. This is why cash-out refis have been so important over the pastfew years as a source of cash for home owners. These loans allowhouseholds to turn an illiquid asset into cash. Of course, every time ahomeowner does that, the bank owns more of their home and they ownless, and they are one step farther away from being true home owners.
With illiquid home equity comprising so much of household net worth,what happens now as home-equity loans and lines of credit top 8 percentand home prices fall and, thus, home equity, too? Where will liquiditycome from if it becomes too expensive to extract diminishing homeequity?
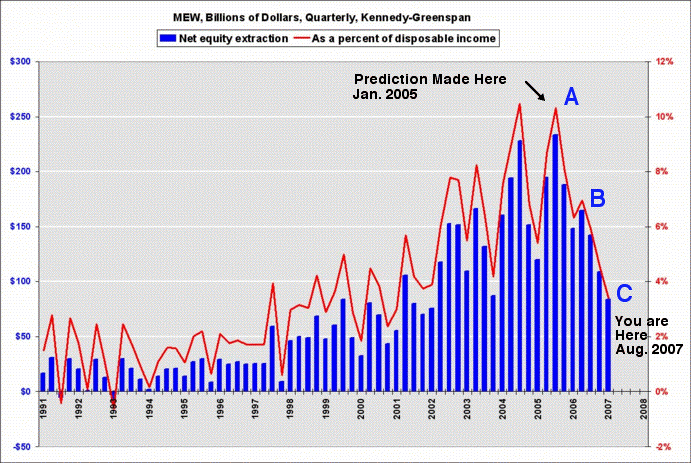
To get an idea of the impact so far and the possible future impact,let's refer back to our January 2005 model and see where we are in the Housing Bubble Correctionprocess. This chart correlates a decline in home equity extraction witha seven step housing bubble correction that takes place over about tenyears.

By this January 2005 estimate, with respect to timing, the housing market bubble areas should be exiting Step C and approaching Step D:

Recent press reports show many US home markets showing Step C and others Step D symptoms, although housing markets are not expected to be fully in Step D until home equity extraction falls to zero in 2008.
Finally, to answer your question, you are only "cornered" if you arenot in a position to ride out another five to eight years or so ofhousing market correction. That may mean working longer than youexpected and delaying your retirement. We know this may not be welcomenews, but we believe our readers are better off prepared for the worstwhile hoping for the best than they are assuming the best and gettingthe worst.
Last edited by Fred : Today at 12:34 PM.
 |
So I'm reading my favorite financial news source Yahoo! Finance and come across this article Your House: Breaking the Bank that says:
If you've been reading Money Magazine for any length of time, yousurely get that saving for retirement should be your top financialpriority. Even so, the past decade's easy appreciation in home valueshas made such fundamental advice seem, well, a lot less urgent.It goes on to say:
Or so suggests a National Bureau of Economic Researchpaper recently published in the Journal of Monetary Economics.Comparing results from the biennial University of Michigan Health andRetirement study, researchers found that, excluding home and businessequity, 51- to 56-year- olds hold less wealth than the same age groupdid in 1992.
"These boomers look richer, but a lot of that wealth is because oneasset [their house] revalued," says co-author Annamaria Lusardi, aprofessor of economics at Dartmouth. "Excluding housing, people havevery little in other wealth components."
- My home value may have morethan doubled during the boom, but real estate markets have also beenknown to suffer prolonged stagnation, even downturns.
- Selling my house and buying a smaller one may not leave me flush with cash.
- I may not be able to tap my equity and invest it for even better returns.
I have nearly all of my retirement money sunk into my house and I planto retire in a few years. How will I retire? Houses are not selling inmy area and I have no other source of retirement money. All of myfriends are in the same position. I bet my problem is common. What doesthis mean for the economy?
Signed,
Cornered in California
The bad news is you have indeed been duped into putting far too much ofyour savings into your home. The good news is... you are not alone!
Over the years you've probably read dozens of articles extolling thegreat rise in household wealth in the U.S. over the past 20 years. Wedeveloped this chart in our article about USA, Inc.to show just where the all that much touted household net worth islocated on the household balance sheet, along with who has it and whodoesn't, and how much of that is liquid–that is, can actually be spent,versus how much is tied up in an asset that must be sold or put up ascollateral for a loan before the owner has cash to spend.

As you can see, only the top percentiles have much in the way of totalnet worth. The mean level of total net worth is $227,000. Of that, only$46,000 is liquid, with $62,000 tied up in real estate and only $16,000invested in IRAs and Keochs. Real estate makes up the majority of networth all the way up to the 90th percentile. Only when you reach the95th percentile do you see home equity merely equal to liquid networth. This is why cash-out refis have been so important over the pastfew years as a source of cash for home owners. These loans allowhouseholds to turn an illiquid asset into cash. Of course, every time ahomeowner does that, the bank owns more of their home and they ownless, and they are one step farther away from being true home owners.
With illiquid home equity comprising so much of household net worth,what happens now as home-equity loans and lines of credit top 8 percentand home prices fall and, thus, home equity, too? Where will liquiditycome from if it becomes too expensive to extract diminishing homeequity?
To get an idea of the impact so far and the possible future impact,let's refer back to our January 2005 model and see where we are in the Housing Bubble Correctionprocess. This chart correlates a decline in home equity extraction witha seven step housing bubble correction that takes place over about tenyears.

By this January 2005 estimate, with respect to timing, the housing market bubble areas should be exiting Step C and approaching Step D:
The most recent Kennedy-Greenspan report onhome equity extraction shows home equity in fact slowing nearly at thesame rate as our January 2005 model anticipated.Step C: Afterprices have declined for two years, large numbers of buyers whopurchased near the top of the market will begin to feel thepsychological effects of being underwater on their mortgage. They willbe less inclined to borrow money, or to spend money fixing up theirhome, as home improvement value increases will be swallowed up bygeneral market price declines. There will still be profits to be madeby those who bought very early in the previous boom cycle, but fewerpeople will have this option.
As transaction volumes continue to fall, demand for housing-relatedemployment will decline too. The first signs of labor market distresswill start to show up, as more and more of that 43% of the privatesector who found jobs in the housing industry are no longer needed.Coincidentally, major employers—such as the U.S. auto industry—will begoing through major restructuring, adding to pressures on housingprices in some areas. Some home owners will need to sell at a loss inorder to move to regions of the country where the labor picture isbetter, and will do this if they have enough equity and are not payingcash out of pocket to cover their remaining mortgage obligations. Thesesales will further depress home prices.
Step D: Three years into the decline, marginal home buyerswill learn what owning a home really costs, versus renting when housingprices are declining and jobs are more scarce. Rent is a fixed cost,whereas home ownership presents many variable costs, includingincreased interest payments on ARMs, and rising tax, insurance, andenergy costs. Also, upkeep for the average home typically costs five toten percent of the price of the home, annually. As prices fall,homeowners will have less access to home equity loans. Many will not beable to afford repair and maintenance expenses. Homes in someneighborhoods—and in some cases, entire neighborhoods—will begin tolook neglected, further depressing prices.

Recent press reports show many US home markets showing Step C and others Step D symptoms, although housing markets are not expected to be fully in Step D until home equity extraction falls to zero in 2008.
Foreclosures a blight on Manteca
They were once symbolic of the American Dream. Now they are eyesores.
Front yards full of weeds and dead grass, along with boarded up orbroken windows, are the signs of houses in foreclosure in this CentralValley town where commuters came in search of homes they could afford.
More Than One-Million U.S. Construction Jobs Could Be Lost
The nation's housing slump and credit squeeze could mean theconstruction industry will shed more than a-million jobs in the comingmonths. An official with the National Association of Home Builders saidthe job cuts could be deeper than those made during the 1990s recession.
National Home Prices Drop for First TimeIf our models continue to hold up as well in the future asthey have over the previous two and half years, then the housing marketand economy still have to complete steps D, E, F, and G of declinebefore the market bottoms out. Our model is for a 10 year downturn,starting from the top in June 2005. That means we have another five to eight years to go.
When you think about places hardest hit by the current housingslowdown, states such as California, Nevada and Florida come to mind.
But now new figures indicate that a contained real estate bubble isspreading, and it's affecting home prices across the country.
Finally, to answer your question, you are only "cornered" if you arenot in a position to ride out another five to eight years or so ofhousing market correction. That may mean working longer than youexpected and delaying your retirement. We know this may not be welcomenews, but we believe our readers are better off prepared for the worstwhile hoping for the best than they are assuming the best and gettingthe worst.
__________________
Ed.
Ed.
Last edited by Fred : Today at 12:34 PM.
評論
目前還沒有任何評論
登錄後才可評論.


