炒股貽性

借助日常的炒股實踐活動,增強大腦思維活動強度。記錄每天對股市走勢的觀察,分析和預判,不斷地提高個人對股市客觀規律的認知,不斷地提高炒股操作水準。
個人資料
正文

MU 走勢觀察,option對股價的牽製作用

(2018-01-06 08:38:43) 下一個

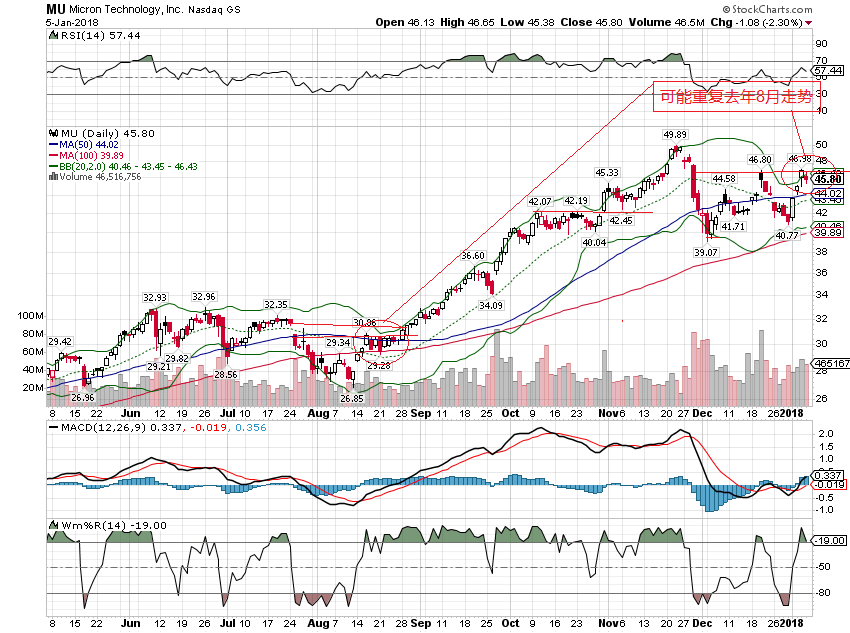
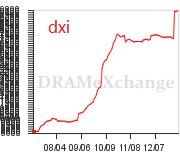
mu的股價去年11月下旬達到曆史高點50以後,回調幅度達20%。此後12月18日季報,當季的盈利和下個季度的預期均超過分析師的預期20%。但是超好的季報數據沒有能夠提振mu的股價,股價二次探底,直到年後mu連續三天強反彈,漲幅達14%。上周五,mu股價逆勢下跌2%(見圖)。現在發現,mu的股價大起大落,和它近期FA變化有關。mu的主要產品dram屬於大宗物質,價格依賴市場供求而變化。dram價格指數圖顯示,去年十月下旬開始到年末,dram的價格失去前期的上升動力,一直走平(見圖)。根據此點,分析師下調了mu的評級,從而導致mu的股價大幅回調。在新的一年,市場對dram的需求仍然表現強勁,dram股價指數dxi突漲9%(見下圖),這就是mu年後三天大漲14%的原因。上周五mu逆勢下跌的原因,可以從TA角度解釋。上周四mu收盤在46.9,恰好處於W型底部的頸線位置,上周五mu股價回落,可以看作是正常的回踩過程。如無意外,mu下周應當越過頸線阻力區,衝擊前期高點50。上周五mu股價下跌2.3%的另一個可能的解釋是mu的option賣方MM為了殺到期的巨量call而有意殺跌mu股價。上周五到期的mu45.5call和46.0call的OP分別是一萬八千和一萬一千(見下表)。周五mu收盤在45.8,上述巨量call歸零。Jan 12 到期mu call的OP的量比 Jan 5 到期的call的OP數量明顯少,對下周mu股價的牽製作用可能要減少。Jan 19到期的mu 46.0call和46.5call分別是6萬5千和二萬六千。因此,mu在Jan 19 的收盤價有可能被MM控製在46.0附近。上麵的假設是否正確,拭目以待。個人看法,不做投資依據。

xx


MU


45.80


45.81


45.80


-1.08


-2.30


100X4000


46.655


45.3752


46,455,697


Fri Jan 5 2018 4:01:11 pm ET|https://invest.ameritrade.com/amer/images/icn_refreshBlue.gif


MU Jan 5 2018

0 Days to Expiration (Weeklys)


Expand Collapse


Calls Calculator


Bid


Ask


Last


Change


Vol


Op Int


44.5 Callhttps://invest.ameritrade.com/amer/images/optionchain/btn_QuoteMenu_Up.gif


1.24


1.34


1.36


-1.06


712


5,339


45.0 Callhttps://invest.ameritrade.com/amer/images/optionchain/btn_QuoteMenu_Up.gif


0.74


0.84


0.77


-1.16


2,293


7,147


45.5 Callhttps://invest.ameritrade.com/amer/images/optionchain/btn_QuoteMenu_Up.gif


0.24


0.34


0.30


-1.15


4,624


18,295


46.0 Callhttps://invest.ameritrade.com/amer/images/optionchain/btn_QuoteMenu_Up.gif


0.00


0.01


0.01


-1.01


10,345


11,069


46.5 Callhttps://invest.ameritrade.com/amer/images/optionchain/btn_QuoteMenu_Up.gif


0.00


0.01


0.01


-0.66


7,048


4,449


47.0 Callhttps://invest.ameritrade.com/amer/images/optionchain/btn_QuoteMenu_Up.gif


0.00


0.01


0.01


-0.39


3,616


4,418


Strike

44.50

45.00

45.50

46.00

46.50

47.00


Puts Calculator


Bid


Ask


Last


Change


Vol


Op Int


44.5 Puthttps://invest.ameritrade.com/amer/images/optionchain/btn_QuoteMenu_Up.gif


0.00


0.02


0.02


-0.02


2,018


1,862


45.0 Puthttps://invest.ameritrade.com/amer/images/optionchain/btn_QuoteMenu_Up.gif


0.00


0.01


0.01


-0.04


1,758


2,515


45.5 Puthttps://invest.ameritrade.com/amer/images/optionchain/btn_QuoteMenu_Up.gif


0.00


0.02


0.01


-0.06


4,011


1,723


46.0 Puthttps://invest.ameritrade.com/amer/images/optionchain/btn_QuoteMenu_Up.gif


0.17


0.24


0.22


0.08


9,413


4,372


46.5 Puthttps://invest.ameritrade.com/amer/images/optionchain/btn_QuoteMenu_Up.gif


0.67


0.74


0.65


0.36


2,732


1,422


47.0 Puthttps://invest.ameritrade.com/amer/images/optionchain/btn_QuoteMenu_Up.gif


1.17


1.26


1.22


0.70


822


624


Color indicates options that are in-the-money https://invest.ameritrade.com/amer/images/icn_NS.gifIndicates non-standard option
The in-the-money indication does not apply to non-standard options.


MU Jan 12 2018

7 Days to Expiration (Weeklys)


Calls Calculator


Bid


Ask


Last


Change


Vol


Op Int


44.5 Callhttps://invest.ameritrade.com/amer/images/optionchain/btn_QuoteMenu_Up.gif


1.71


1.78


1.75


-1.01


541


2,372


45.0 Callhttps://invest.ameritrade.com/amer/images/optionchain/btn_QuoteMenu_Up.gif


1.41


1.43


1.41


-0.95


2,493


4,770


45.5 Callhttps://invest.ameritrade.com/amer/images/optionchain/btn_QuoteMenu_Up.gif


1.11


1.13


1.11


-0.88


2,082


1,594


46.0 Callhttps://invest.ameritrade.com/amer/images/optionchain/btn_QuoteMenu_Up.gif


0.85


0.87


0.86


-0.82


6,906


3,087


46.5 Callhttps://invest.ameritrade.com/amer/images/optionchain/btn_QuoteMenu_Up.gif


0.65


0.67


0.65


-0.74


4,351


1,488


47.0 Callhttps://invest.ameritrade.com/amer/images/optionchain/btn_QuoteMenu_Up.gif


0.48


0.51


0.50


-0.63


3,931


2,425


Strike

44.50

45.00

45.50

46.00

46.50

47.00


Puts Calculator


Bid


Ask


Last


Change


Vol


Op Int


44.5 Puthttps://invest.ameritrade.com/amer/images/optionchain/btn_QuoteMenu_Up.gif


0.46


0.48


0.47


0.12


699


1,028


45.0 Puthttps://invest.ameritrade.com/amer/images/optionchain/btn_QuoteMenu_Up.gif


0.62


0.64


0.63


0.17


1,108


2,126


45.5 Puthttps://invest.ameritrade.com/amer/images/optionchain/btn_QuoteMenu_Up.gif


0.82


0.84


0.85


0.26


1,153


976


46.0 Puthttps://invest.ameritrade.com/amer/images/optionchain/btn_QuoteMenu_Up.gif


1.07


1.09


1.10


0.33


2,352


778


46.5 Puthttps://invest.ameritrade.com/amer/images/optionchain/btn_QuoteMenu_Up.gif


1.36


1.37


1.30


0.31


794


2,164


47.0 Puthttps://invest.ameritrade.com/amer/images/optionchain/btn_QuoteMenu_Up.gif


1.69


1.72


1.66


0.44


238


540


Color indicates options that are in-the-money https://invest.ameritrade.com/amer/images/icn_NS.gifIndicates non-standard option
The in-the-money indication does not apply to non-standard options.


MU Jan 19 2018

14 Days to Expiration


Expand Collapse


Calls Calculator


Bid


Ask


Last


Change


Vol


Op Int


44.5 Callhttps://invest.ameritrade.com/amer/images/optionchain/btn_QuoteMenu_Up.gif


2.12


2.15


2.10


-0.98


511


2,180


45.0 Callhttps://invest.ameritrade.com/amer/images/optionchain/btn_QuoteMenu_Up.gif


1.80


1.84


1.79


-0.93


7,309


51,816


45.5 Callhttps://invest.ameritrade.com/amer/images/optionchain/btn_QuoteMenu_Up.gif


1.52


1.55


1.52


-0.86


1,423


2,216


46.0 Callhttps://invest.ameritrade.com/amer/images/optionchain/btn_QuoteMenu_Up.gif


1.28


1.30


1.27


-0.80


5,056


65,013


46.5 Callhttps://invest.ameritrade.com/amer/images/optionchain/btn_QuoteMenu_Up.gif


1.04


1.08


1.05


-0.75


2,073


25,928


47.0 Callhttps://invest.ameritrade.com/amer/images/optionchain/btn_QuoteMenu_Up.gif


0.86


0.89


0.87


-0.68


2,971


15,594


Strike

44.50

45.00

45.50

46.00

46.50

47.00


Puts Calculator


Bid


Ask


Last


Change


Vol


Op Int


44.5 Puthttps://invest.ameritrade.com/amer/images/optionchain/btn_QuoteMenu_Up.gif


0.82


0.86


0.83


0.17


672


1,354


45.0 Puthttps://invest.ameritrade.com/amer/images/optionchain/btn_QuoteMenu_Up.gif


1.01


1.03


1.01


0.22


5,001


13,070


45.5 Puthttps://invest.ameritrade.com/amer/images/optionchain/btn_QuoteMenu_Up.gif


1.22


1.25


1.19


0.24


210


3,412


46.0 Puthttps://invest.ameritrade.com/amer/images/optionchain/btn_QuoteMenu_Up.gif


1.47


1.50


1.47


0.32


895


11,151


46.5 Puthttps://invest.ameritrade.com/amer/images/optionchain/btn_QuoteMenu_Up.gif


1.75


1.78


1.61


0.24


981


1,551


47.0 Puthttps://invest.ameritrade.com/amer/images/optionchain/btn_QuoteMenu_Up.gif


2.06


2.09


1.88


0.26


88


3,586


Color indicates options that are in-the-money https://invest.ameritrade.com/amer/images/icn_NS.gifIndicates non-standard option
The in-the-money indication does not apply to non-standard options.


xx

[ 打印 ]
閱讀 ()評論 (0)
評論
目前還沒有任何評論
登錄後才可評論.