


個人資料
最新文章
文章分類
歸檔
2017 (101)
2019 (393)
最新評論

正文
GDX is bouncing between MA 50 and MA 200, and it is also bouncing between pink line and green line, forming a triangle. The future trend depends on which direction it will break out.
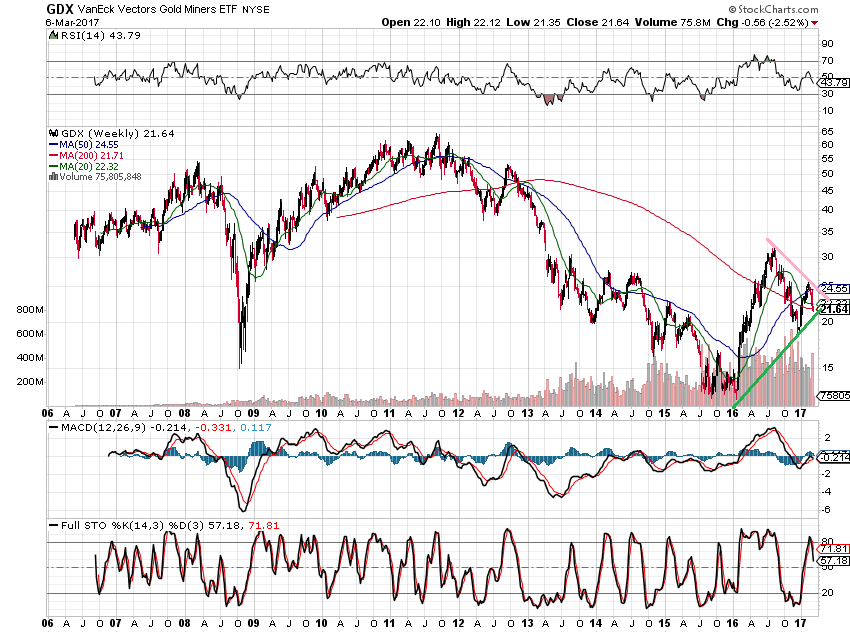
IMHO, the bias is up, based on wave count.
A head-and-shoulder pattern can be recognized on the chart.
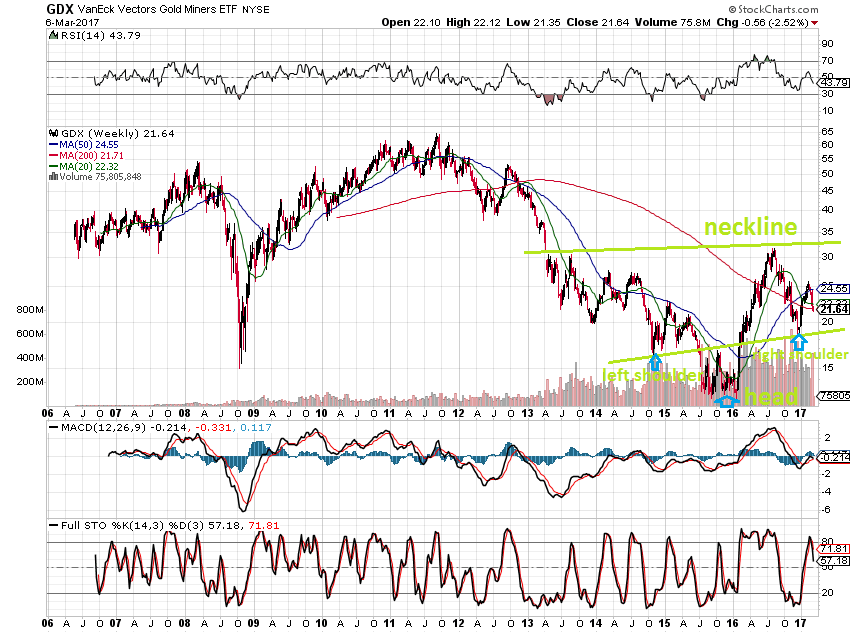
And I would imagine a huge W pattern on the chart.


評論
目前還沒有任何評論
登錄後才可評論.