GDX is bouncing between MA 50 and MA 200, and it is also bouncing between pink line and green line, forming a triangle. The future trend depends on which direction it will break out.
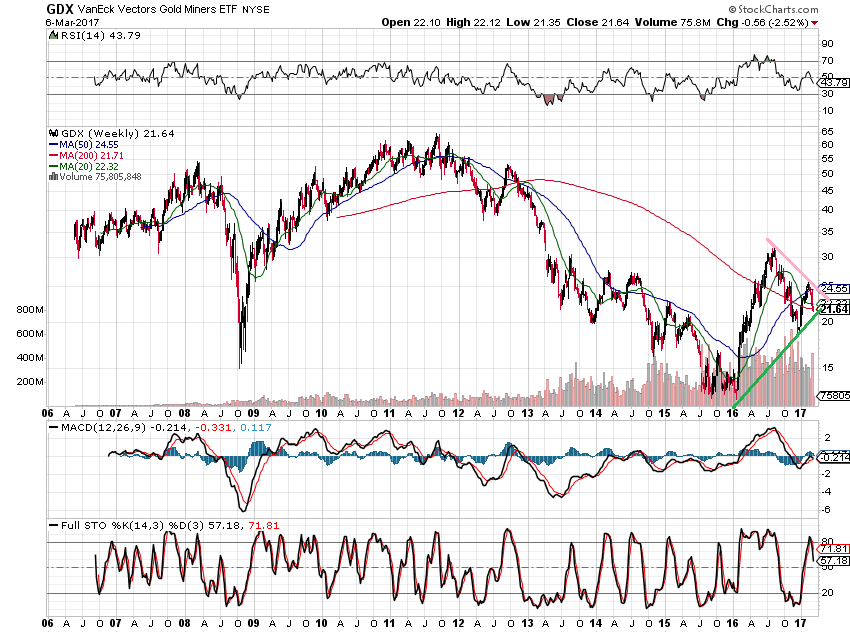
IMHO, the bias is up, based on wave count.
A head-and-shoulder pattern can be recognized on the chart.
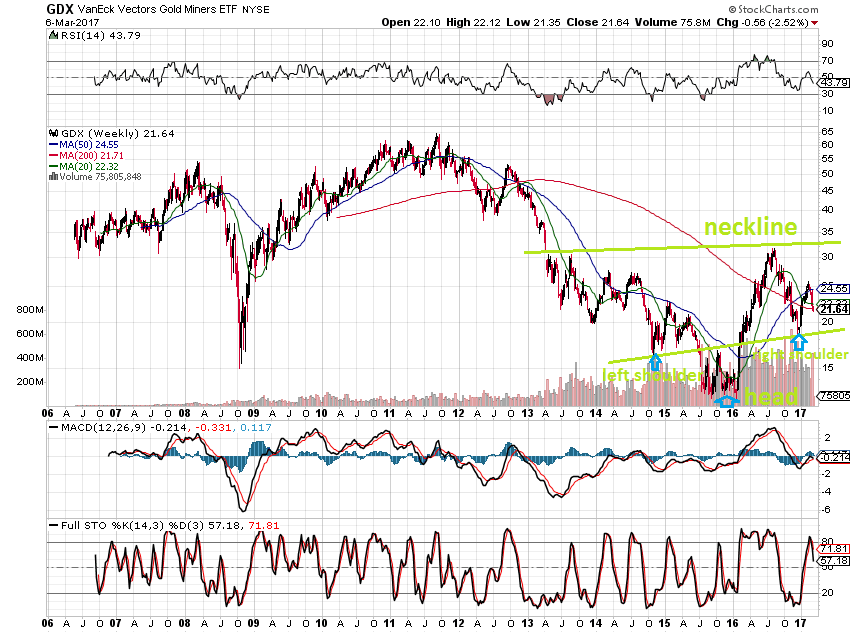
And I would imagine a huge W pattern on the chart.

|