子夜讀書心筆
寫日記的另一層妙用,就是一天辛苦下來,夜深人靜,借境調心,景與心會。有了這種時時靜悟的簡靜心態, 才有了對生活的敬重。


 THE BULLBEAR MARKET REPORT by Steven Vincent
A period of trendless consolidation has begun. Will it resolve to the updside or downside?
SUMMARY
Since the last BBMR on May 9th, the equities markets have made a top and generally, though not universally, the trend from the March bottom has been broken. There is no clear downtrend in force as yet and support has held to date. Market action and technicals are suggestive of a consolidation rather than a change of trend. Fundamentally, the downgrade of British sovereign debt and the threat of a similar downgrade to US Treasury bonds has the potential to be a "game changer" and puncture confidence at a delicate psychological and technical juncture. Commodities markets, particularly the precious metals, have continued higher even as equities have stalled and the action in those markets are supportive of the reflation/inflation trade hypothesis. Technically, equities markets continue to near a resolution which is graphically illustrated by the relationship between the 50 and the 200 EMA, with the 50 day continuing to rise and the 200 day falling to meet it. A crossover is due anytime within the next 5-12 sessions.
The author's expectation continues to be that the fundamentals will continue to show gradual improvement, that concerns about sovereign debt and the global economy will continue to play out as bricks in the classic "Wall of Worry" and the markets will manifest this with a bullish crossover of the 50 and 200 EMA, signaling a new bull market. On the other hand, there are still major, structural forces at work in the markets and the world economy which could effectively neutralize the massive reflationary forces unleashed by fiscal and monetary policy leading to a bearish resolution. Traders and investors are invited to exercise extreme caution at this time as this period of volatile trendlessness resolves itself. Patience will be rewarded. My current equties market stance in all time frames is NEUTRAL. My current commodities market stance (with particular emphasis on the Precious Metals sector) is BULLISH.
FUNDAMENTAL ANALYSIS
The primary economic fundamental in an economy based on a fiat debt monetary system is the flow of liquidity. Regardless of one's philosophical leanings, the fact remains that our capital markets and indeed the entire US economy is not much more than a Ponzi scheme. It relies upon the ability and willingness of the next party to go into debt to support the already existing indebtedness. The primary question the trader must ask and answer is: are there more buyers of debt with more available equity who want to risk the Ponzi game or are more sellers of debt who need financing or need to cash out of the game?
At this juncture massive forces of inflation and deflation are seeking resolution. Heretofore unimaginable monetary inflation and fiscal stimulus may, for a time, reflate asset prices in spite of deep structural issues in the real economy. On the other hand, said structural issues may be so profound as to render such inflation ineffective.
The recent downgrade of British sovereign debt followed by the apparent threat of a similar downgrade to US Treasury debt is what I would consider to be a "next phase" event. It is the kind of fundamental development which would accompany the next stage of "The Collapse". Either the structural issues involved are so profound and so immediate that they have arrived early, or this is more of the fearmongering and "Wall of Worry" playing itself out.
Jesse Livermore pointed out that the news of the day is not important, it's the market's reaction to the news which matters. Thus far, the market reaction to this singular fundamental news has been quite muted. Let's also keep in mind that by the time you or I get to reading or writing about such a development, the market has already anticipated it and priced in the news. At this moment in time it appears that the sovereign debt issue is more a "Wall of Worry" issue than an immediate threat to world economic stability. Let's recall that at the bottom in March the financial media were spreading fear of imminent sovereign debt collapse across Europe, a catastrophe which never manifested. Here's a bit of what may be "Wall of Worry" thinking.
There could, however, be a delayed reaction particularly if the news continues to suggest an impending debt crisis. Again, the Ponzi scheme depends on debt being sold into the marketplace and if no one is buying then it truly is "game over". The action in the US bond market and the US dollar recently is certainly throwing up a yellow flag and the situation warrants vigilance.
MARKET ANALYSIS
In the last BBMR, I noted that the salient chart feature across the board was the developing relationship between the 50 and 200 day EMA. I noted that this relationship signaled a transitional period which is almost always characterized by a period of trendless volatilty. That period is now upon us and appears to be about half completed. This is, in my opinion, a good time to be out of the equities markets and on the sidelines awaiting a good opportunity. The trade of late has been and likely will continue to be choppy and the churn will result in losses for all but the most nimble daytraders.
The commodities markets are showing an entirely different picture. The technical performance in this sector strongly suggests that the inflation/reflation trade hypothesis is valid. In particular, the precious metals sector is showing a very bullish configuration. This is a good time to get long gold, silver and the miners.
If the trade in the commodities market does indeed play out bullishly, we can deduce this as a leading indicator of renewed equities market strength in the relatively near future. Note that commodities signaled the turnaround in equities by about 2 months prior to the March bottom.
A survey of the charts at this time shows that across the board the 50 EMA is rising to meet the 200 EMA with price trading in between the two. Most charts are showing a symmetrical or right triangle consolidation produced in the environment of a low volume pullback, a classically bullish technical formation. This is a setup for a transition. It is more than possible for this setup to fail. But there are strong indications that this setup will produce a bullish resolution. Let's have a look at some charts:
INTERMARKET ANALYSIS
Markets outside of the sphere of equities frequently foreshadow developments in the stock markets. At this time many key intermarket indicators appear to be setting up for or currently telegraphing a bullish resolution.
click to enlarge
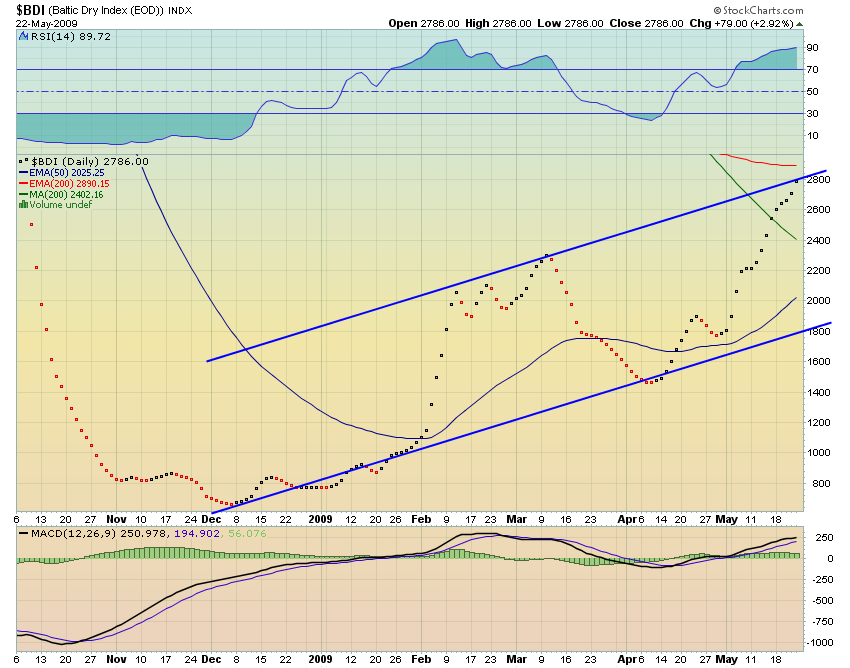
The Baltic Dry Index has been a much touted index of global economic activity and was certainly showcased as a herald of worldwide economic collapse. It's interesting that bears are silent on this index now that is in a definite uptrend and priced at recovery highs. The recovery in the BDI gives the lie to the global depression hypothesis. The chart shows price rising between the 200 and 50 EMA with the latter upturning. Price has indeed leapt above the 200 SMA and recently found support in the area of the 50 EMA which is also bullish action. This market is due for a pullback from its declining 200 EMA and the top of its trend channel.
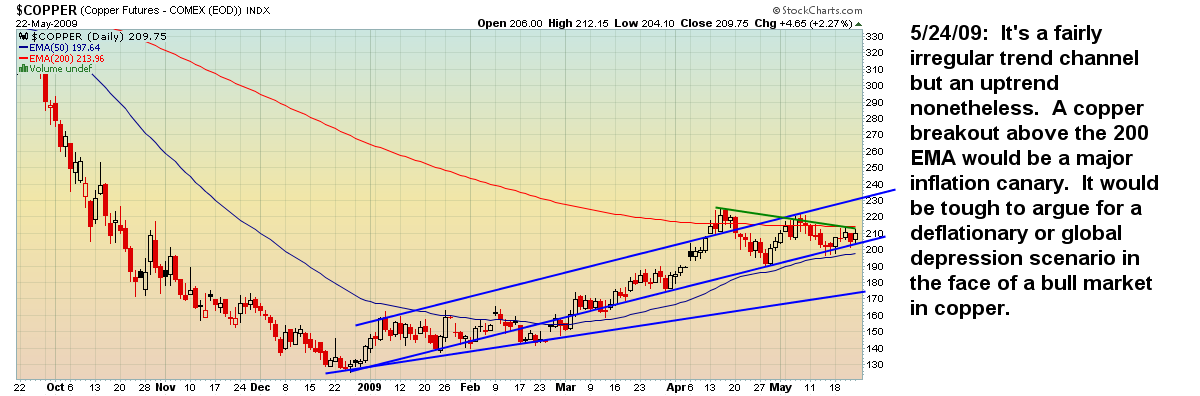
Copper is also considered a leading indicator of global economic activity. The chart shows that price is classically bouncing between the 50 EMA and the 200 EMA, retreated to nearly the 50 EMA and has now closed above the 200 EMA on a weekly basis. This is a very bullish development and strongly contradicts the recession/depression thesis. It is also a harbinger of inflation. At this time China is taking much of its recently appreciated dollar reserves and buying up recently depreciated hard assets like copper.
It's a fairly irregular trend channel but an uptrend nonetheless. A copper breakout above the 200 EMA would be a major inflation canary. It would be tough to argue for a deflationary or global depression scenario in the face of a bull market in copper. This chart is nearing the point of resolution at the apex of a symmetrical triangle with the 200 EMA just above. A breakout would be very bullish for world markets indeed. Also of note is a bullish cup and handle formation (uncharted), one of the most reliable formations in technical analysis.
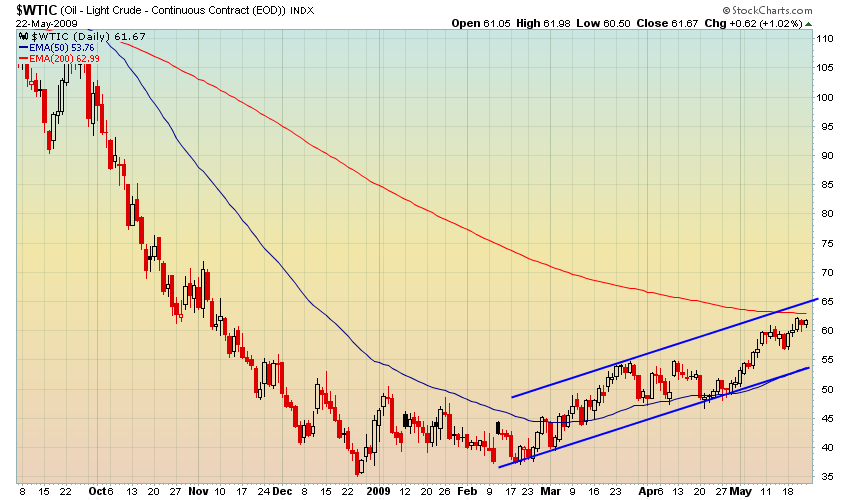
CRUDE OIL has broken above its 50 EMA and then retested it several times and has broken out strongly in the direction of the 200 EMA. The fundamental implications of this are the same as for copper. Crude also is poised to take out its 200 EMA and remains in a clear, solid uptrend.
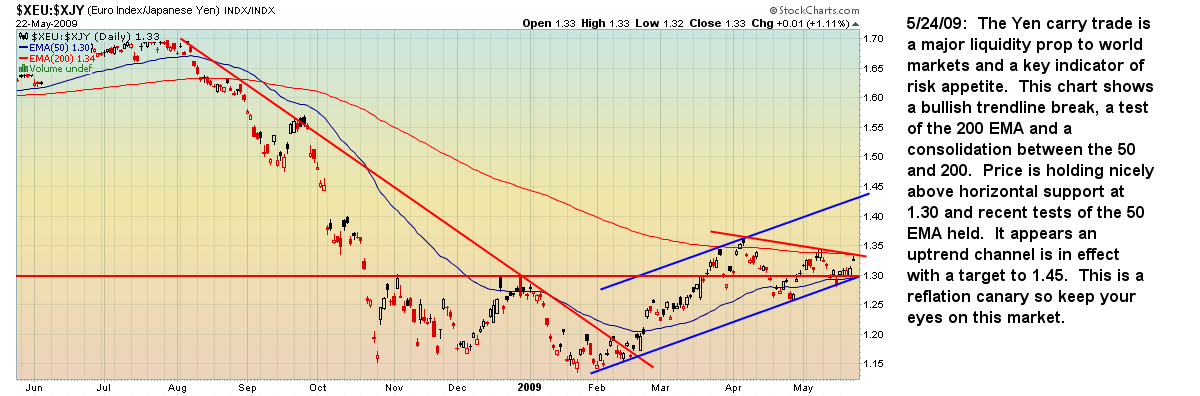
The EuroYen has long been both an indicator of risk appetite and a major direct engine of liquidity to world markets via the Yen carry trade. The willingness of market participants to take on risk by selling the Yen and investing the proceeds in higher yielding assets is a leading indicator of recovery in asset prices. This cross is now challenging its 200 EMA and has been playing between the 50 and 200 for months. This chart is a great illustration of the transitional process that unfolds in a market as it moves from bear to bull. The market is likely to jump over the 200 EMA soon followed by a bullish 50/200 EMA cross within 45 days.
This chart shows a bullish trendline break, a test of the 200 EMA and a consolidation between the 50 and 200. Price is holding nicely above horizontal support at 1.30 and recent tests of the 50 EMA held. It appears an uptrend channel is in effect with a target to 1.45. This is a reflation canary so keep your eyes on this market.
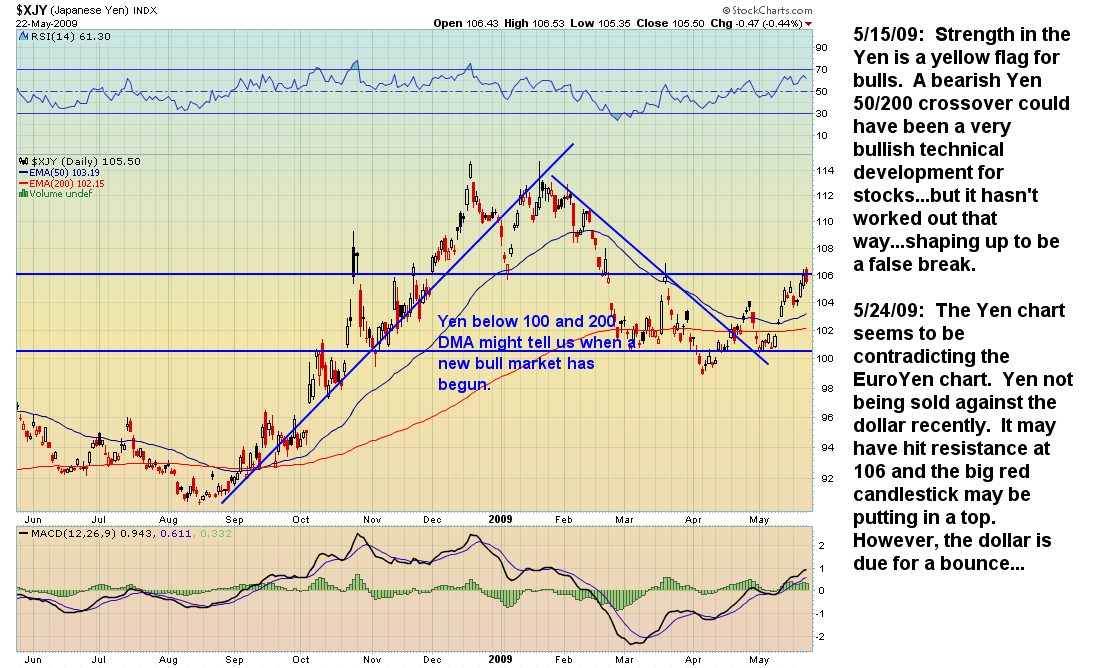
The Japanese Yen is now trading above both the 50 and 200 EMA with a bearish 50/200 crossover having aborted. Strength in the Yen is a yellow flag for bulls. A bearish Yen 50/200 crossover could have been a very bullish technical development for stocks...but it hasn't worked out that way and is instead shaping up to be a false break. The Yen chart seems to be contradicting the EuroYen chart. It may have hit resistance at 106 and the big red candlestick may be putting in a top. However, the dollar is due for a bounce...
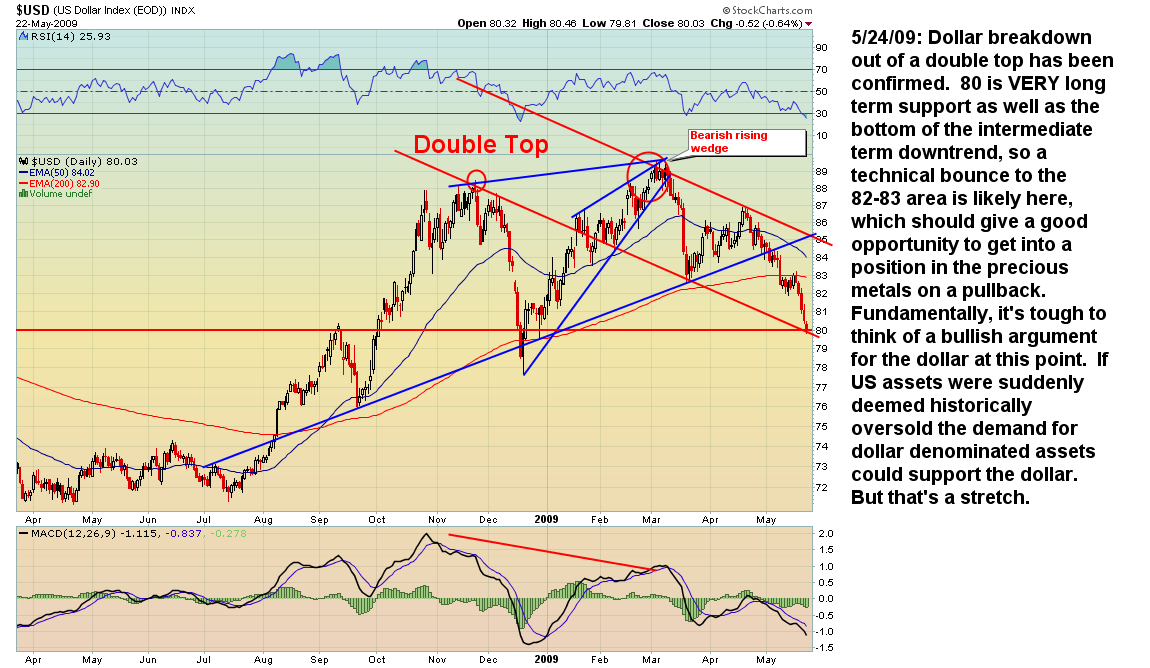
The US Dollar Index has crashed below the 50 and 200 EMA with a bearish crossover appearing to be inevitable. The general technical picture is bearish with a weekly close below the 200 EMA. The mini-bull market in the dollar was a direct result of the Financial Panic and a flight from risk assets to the relative safety of cash. If that worm has turned then cash will be disfavored over risk. The Dollar's breakdown out of a double top has been confirmed with price resting at the key 80 level which is VERY long term support as well as the bottom of the intermediate term downtrend. A technical bounce to the 82-83 area is likely here, which should give a good opportunity to get into a position in the precious metals on a pullback. Fundamentally, it's tough to think of a bullish argument for the dollar at this point. If US assets were suddenly deemed historically oversold the demand for dollar denominated assets could support the dollar. But that's a stretch.
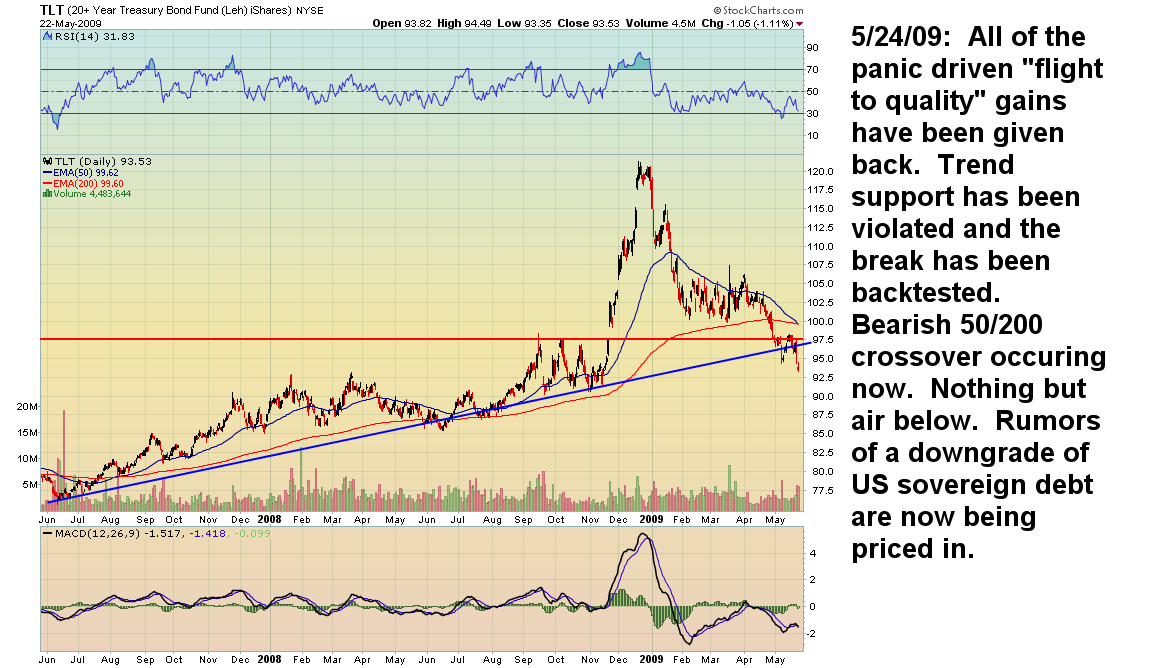
Long Term US Treasuries, which also played a flight to safety role during the Panic, has broken down decisively below its 200 EMA and a bearish 50/200 crossover is imminent. This may be very bullish action for equities since the money parked in Treasuries will look for a new home in risk assets. The breakdown is all the more dramatic given the Fed's new "Quantitative Easing" policy of direct monetization of US debt. Having said that, if there is a panic out of the dollar a panic out of all dollar denominated assets, including equities, could ensue.
At this point, all of the panic driven "flight to quality" gains have been given back. Trend support has been violated and the break has been backtested. A bearish 50/200 crossover is occurring now which will signal a long term bear market in US debt.

Gold is the classic inflation canary and its persistent resistance to the deleveraging trend may be good indicator of future asset price reflation. Technically, Gold had many opportunities to break down and head for its long term trendline in the 650-700 area yet it failed to do so. Once price crossed the 200 EMA and the subsequent bullish 50/200 crossover it held several times on tests of the 200 EMA and has recently broken back above the 50 EMA on a weekly basis. The chart above is a precursor to the price and MA activity of the SPX over the next period as the transitional relationship between the 50 and 200 EMA plays out. The Gold chart here defines a bull market: rising price supported by the 50 EMA on a weekly basis and the 200 EMA on a longer term basis.
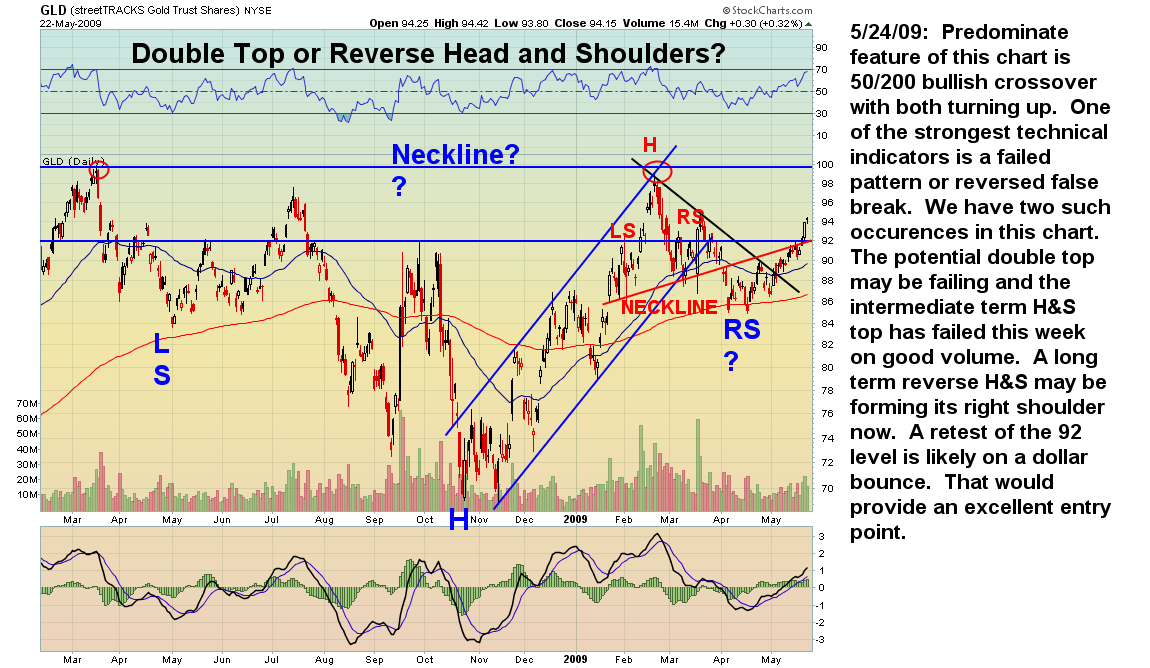
The predominate feature of this chart is 50/200 bullish crossover with both turning up. One of the strongest technical indicators is a failed pattern or reversed false break. We have two such occurrences in this chart. The potential double top may be failing and the intermediate term H&S top has failed this week on good volume. A long term reverse H&S may be forming its right shoulder now. A retest of the 92 level is likely on a dollar bounce soon. That would provide an excellent entry point.
A new, accelerated long term uptrend channel may be forming. The chances of a retest of the old trend is decreasing. If the reverse H&S pattern fulfills itself then we are looking at a move to $1300 in the next move based on a distance of $300 from the neckline to the bottom and the inverse move from neckline to top.
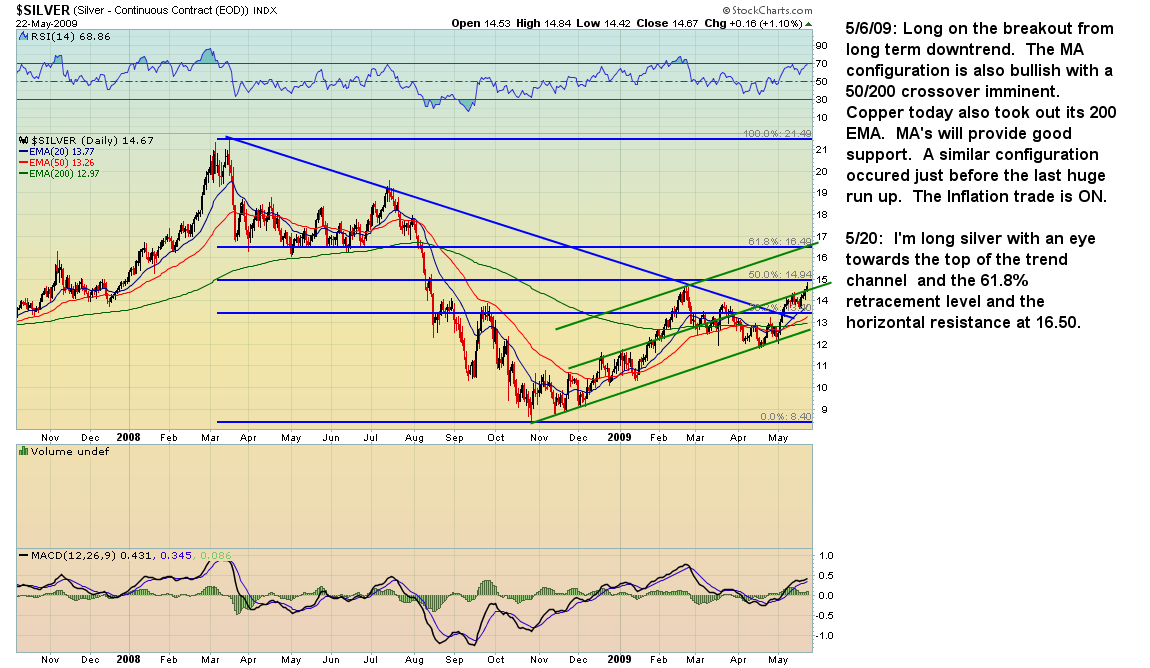
Silver this week signaled a renewed bull market and a bullish 50/200 crossover has occurred. I am long on the breakout from long term downtrend. A similar configuration occurred just before the last huge run up. I'm targeting the top of the trend channel at the 61.8% retracement level and the horizontal resistance at $16.50. A pullback in the next few days on USD technical strength could provide a good entry point. I would buy the dips here if this market interests you. I am favoring silver over gold as it is both an inflation hedge and an industrial metal.
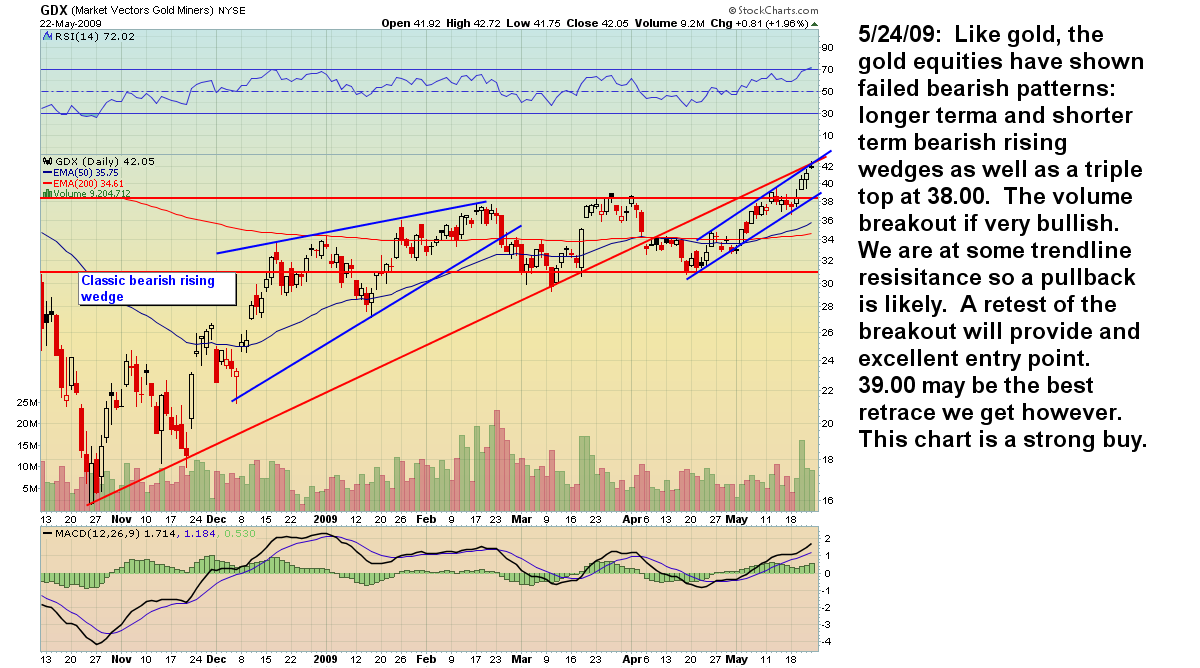
The Gold Miners ETF (GDX) has broken out under very bullish circumstances. Like gold, the gold equities have shown failed bearish patterns: longer term and shorter term bearish rising wedges as well as a triple top at 38.00. The volume breakout is very bullish. The market is at some trendline resistance so a pullback is likely. A retest of the breakout will provide an excellent entry point. $39.00 may be the best retrace we get however. This chart is a strong buy.
The Volatility Index (VIX) trends inversely to the equities markets and is in a clear downtrend. A bearish 50/200 crossover occurred which may be signaling a bull market in equities. Could this be a false signal? Sure! But it's not likely given the extensive process required to produce this technical condition.
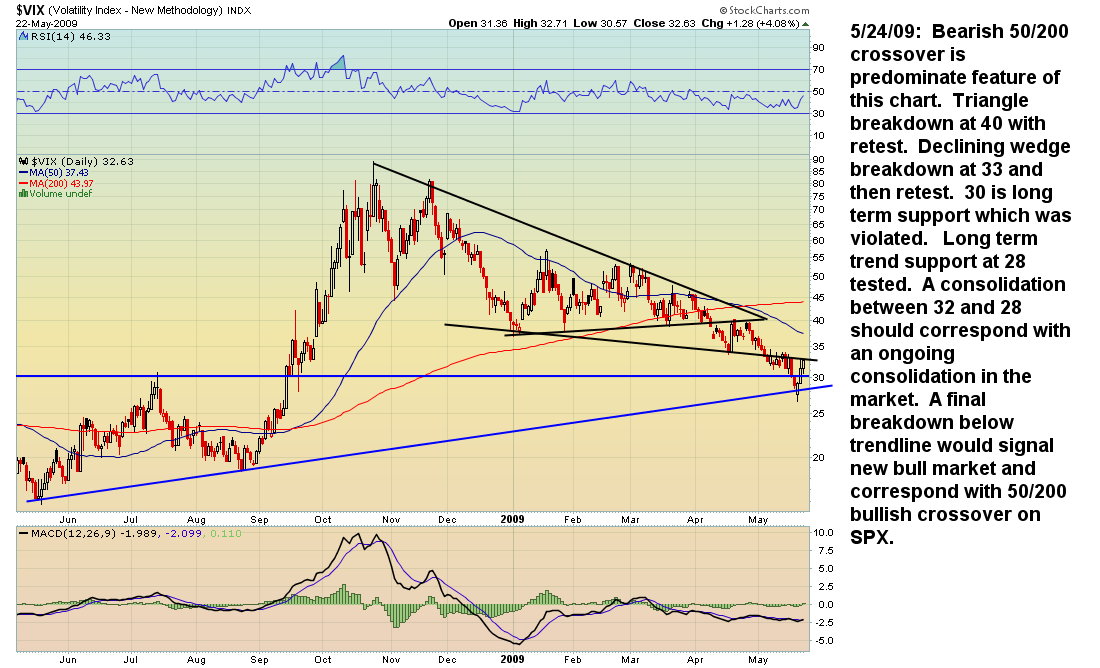
The bearish 50/200 crossover is predominate feature of this chart. There is also a triangle breakdown at 40 with a retest of the break as well as a declining wedge breakdown at 33 and followed by a retest. 30 is long term support which was violated. Long term trend support at 28 has been tested. A consolidation between 32 and 28 should correspond with an ongoing consolidation in the market. A final breakdown below trendline would signal a new bull market and correspond with 50/200 bullish crossover on SPX.
EQUITIES MARKETS
The S&P 500 index of large capitalization stocks is my preferred indicator for overall market trend and performance. We can see that price is consolidating between the 50 and 200 EMA with a test of the declining 200 appearing to be imminent. Although I would suspect a short term pullback to the area of the 50 EMA is likely before the market reaches the 200 EMA, the setup is for a transitional period from bear to bull with an eventual 50/200 crossover. There has been a break of the uptrend from the March lows but as yet a downtrend is not in force.
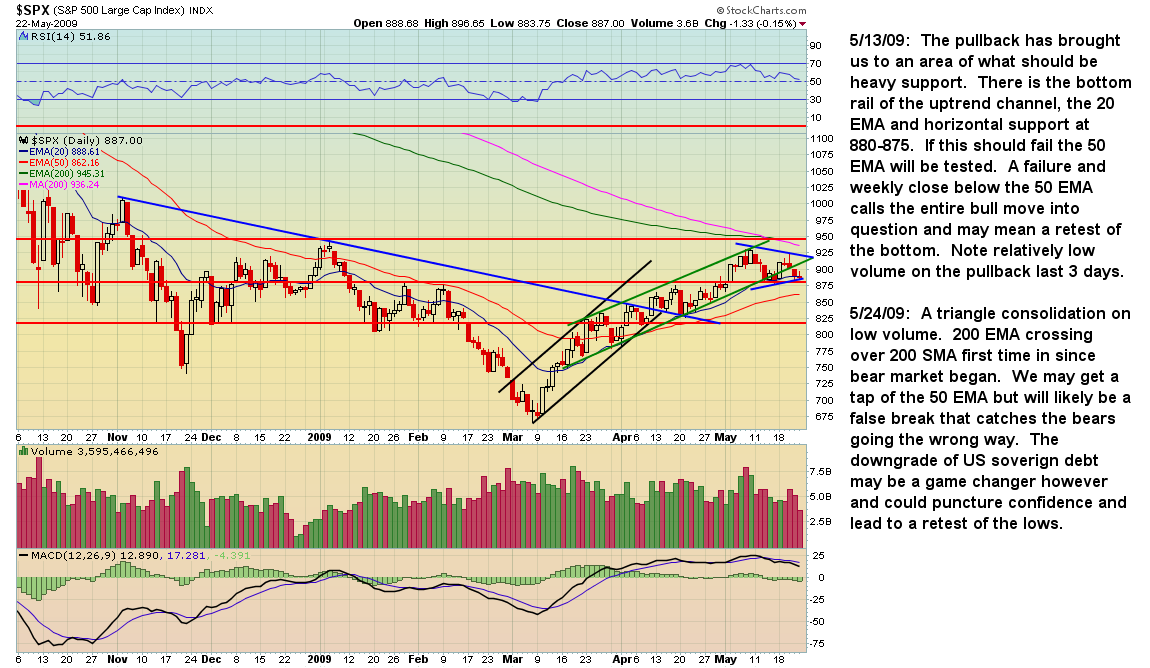
The recent pullback has brought us to an area of what should be heavy support. There is the bottom rail of the uptrend channel, the 20 EMA and horizontal support at 880-875. If this should fail the 50 EMA will be tested. A failure and weekly close below the 50 EMA calls the entire bull move into question and may mean a retest of the bottom. Note relatively low volume on the pullback which gives the chart the overall bullish bias of a triangle consolidation within an uptrend rather than a topping pattern. The 200 EMA has crossed over the 200 SMA first time in since bear market began. We may get a tap of the 50 EMA but will likely be a false break that catches the bears going the wrong way. A downgrade of US sovereign debt may be a game changer however and could puncture confidence and lead to a retest of the lows.

The NYSE Index is a much broader measure of market performance and is still in a clear uptrend, though a short term double top is evident. There was a test of the declining 200 SMA as well.
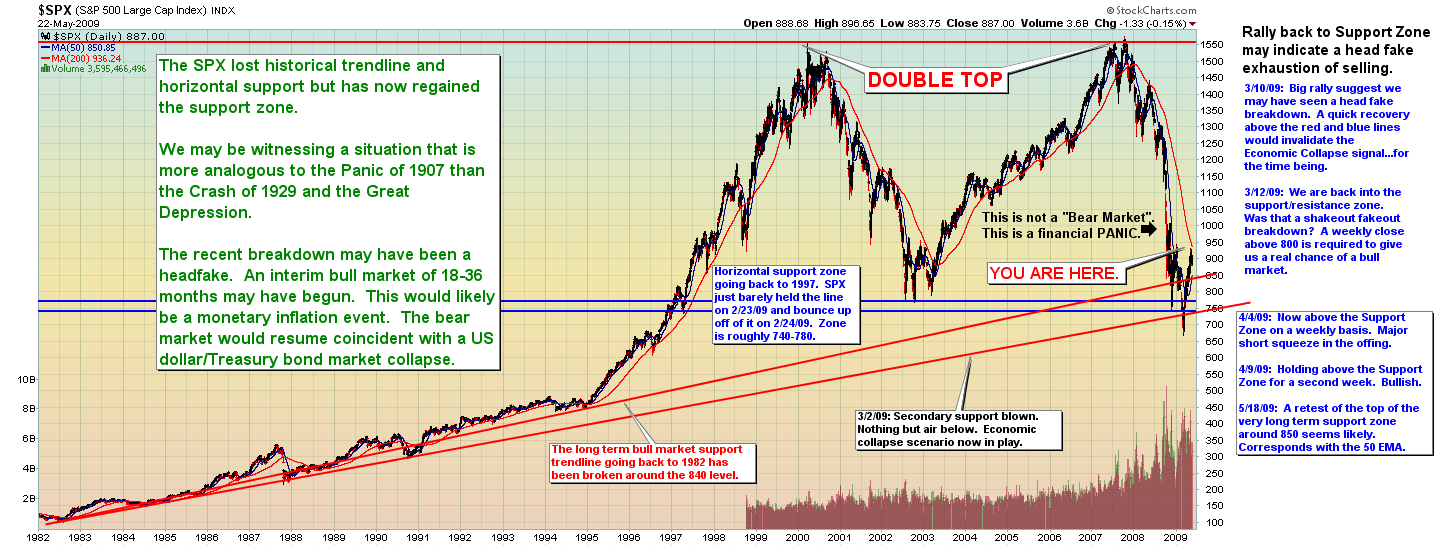
On a very long term basis, the SPX is showing the potential for making a secular bear market bottom. One of the most consistently and powerfully bullish technical occurrences is the false break. A false break of a secular market trendline is particularly powerful. The SPX may in fact have had such a failed technical event at the March break below the market's long term secular bull market support zone. Coming as it did amidst fears of a global economic and financial meltdown this event also takes on characteristics of a panic capitulation bottom. Note the massive volume in the zone of the event (which remains historically elevated as well, I might add). In any case, this hypothesis will be either validated or nullified soon with a bullish 50/200 crossover or a rally failure. It won't be long and patience will pay off.

The Nasdaq 100 (QQQQ) led the move off the March bottom and has maintained a consistent uptrend until breaking trend recently. Price is consolidating in an area much closer to the 200 EMA than the 50 EMA, a bullish development.

Semiconductors (SMH) also led the bull move but has broken trend. Still, price appears to be consolidating bullishly above both the 50 and 200 EMA with the potential for a crossover very soon.
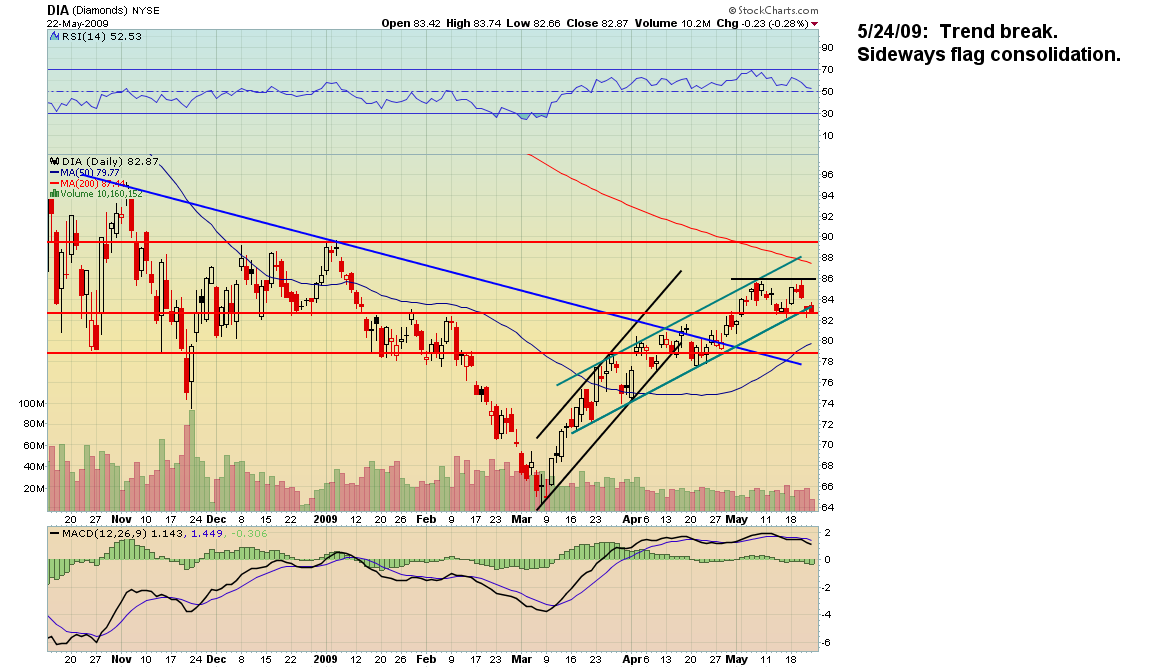
The Dow Industrials (DIA) has lagged other indices. Price is trendlessly consolidating between the 50 and 200 EMA.
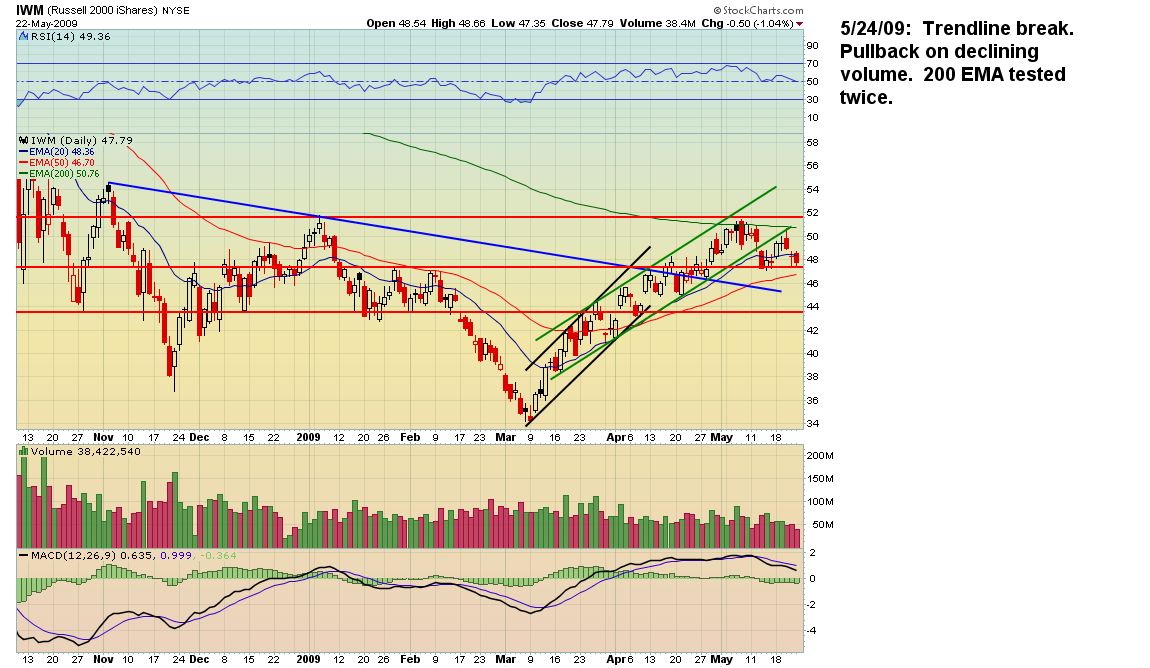
The Russell 2000 Small Cap Index (IWM) has challenged its 200 EMA twice and pulled back on low volume.
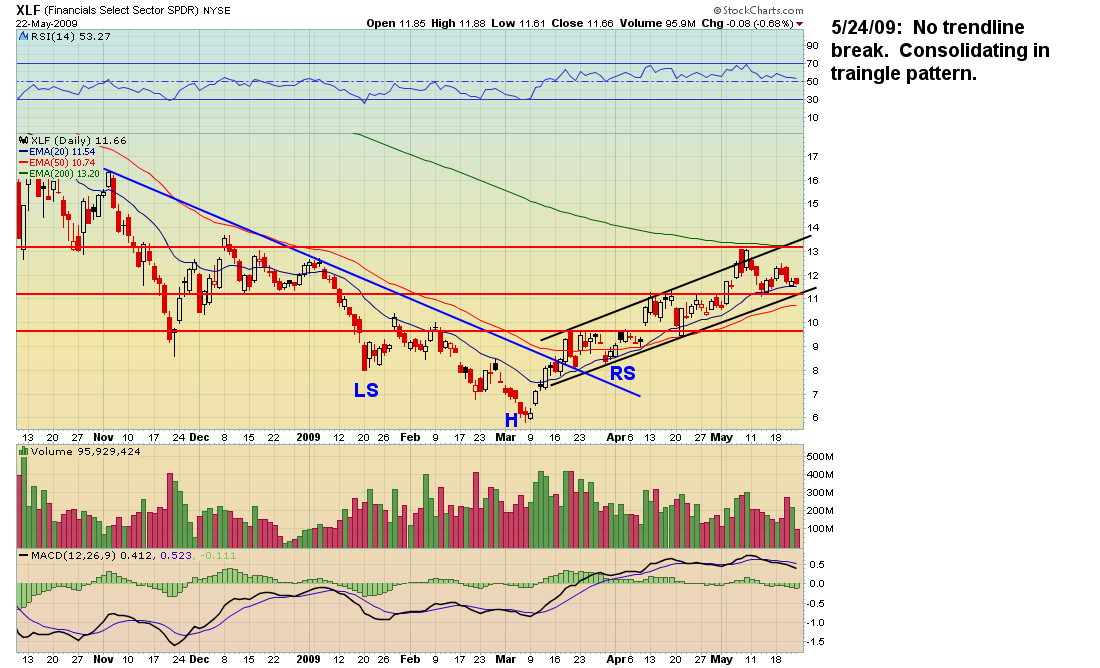
The Financial Sector (XLF) nearly tested its 200 EMA before pulling back after a channel buster. It remains in its uptrend.
THE "WRONG POINT"
This analysis is written with a bullish bias based on an inflationary/reflationary fundamental premise. However, the same technical indicator which would validate this hypothesis would also negate it. Just as a bullish 50/200 crossover would confirm a bull market, a bearish weekly close below the 50 EMA on the SPX would call the nascent bull into question. I call this the "Wrong Point". It's the technical and psychological moment at which I know that my market position is wrong.
I will not be trading both sides of the market during this anticipated range bound transitional period. The range which is being established is far too narrow for any effective or profitable trading. Instead, I am positioning myself long for a market that is breaking out bullishly and establishing a fresh uptrend: the precious metals sector.
CONCLUSION
Having largely completed its initial impulsive short covering rally off an historically oversold bottom produced by a generational Financial Panic, the nascent Bull Market will now consolidate during a transitional period technically characterized by the interplay between price and the 50 and 200 EMAs. Investors will use this period to buy the dips to accumulate positions. Bears will attempt to reposition for an anticipated decline by selling rallies. Trapped longs will also sell rallies into technical resistance in the SPX 925-975 range. The overall effect will be a choppy range trade for a period of time with the eventual 50/200 EMA crossover indicating the longer term trend. Regardless of the direction, the ultimate resolution will give way to a very large and potentially very profitable move.
Disclosure: The author is currently 50% in the double Silver ETF (AGQ) with an eye towards an entry in GDX soon.
Related Articles
| Stock AlertsGet free stock alerts by email: |

This article has 29 comments:
The notion that we had a "generational financial panic", or that the market drop to March had "priced in a total economic collapse" never made any sense to me. It seems absurd that the very same market participants, who expected civilization to end in the first week of March, somehow realized that civilization will prosper by the third week of March; and just because of some talk about "green shoots". If collapse hade been truly a threat, the markets would have dropped far below 666 on the S&P 500.
All that happened is that stocks have returned to their pre-bubble era trendline, as one of your charts showed. That a return from the bubblesphere to reality would occur sharply and traumatically is to have been expected, since the bubble heights were absurd, as the long-term trendline shows.
Now that we are boack to long-term trends, expect a period of relative stability, S&P 500 hovering along long-term trend in the 750 +/- 20% range. I doubt that the market will break out from this range in a sustainable way, on either side, unless exceptional economic developments occur. The move above 900 was short lived, and even a burst up to over 1000 is unlikely to last more than a few weeks and would present a great selling opportunity. On the other hand, a move back to 600 should not be ruled out, and it would not be due to any "collapse scenario" or "multi-generational panic", just be a normal dip below trendline due to a deeper than usual recession, poor earnings, and decimated dividends.