子夜讀書心筆
寫日記的另一層妙用,就是一天辛苦下來,夜深人靜,借境調心,景與心會。有了這種時時靜悟的簡靜心態, 才有了對生活的敬重。


“Words from the Wise” this week comes to you a bit later than usual and in a shortened format as my “day-job” demands keep me from doing my customary commentary. However, a full dose of excerpts from interesting news items and quotes from market commentators is provided.
Stock markets kicked off the last week on a high note, but then the US parted ways with other markets as the remaining four days went downhill for American stocks. In contrast, global markets in general had only one down day on Thursday.
In addition to non-US equities, risky assets such as commodities, oil, gold, silver and platinum, and high-yielding currencies performed strongly amid fresh signs of “less bad” economic and financial conditions. However, safe-haven trades like the US dollar and government bonds got whacked, especially following Standard & Poor’s decision on Thursday to mark down its medium-term outlook for the UK’s AAA credit rating from “stable” to “negative”. This raised concerns that the US may face a similar fate.
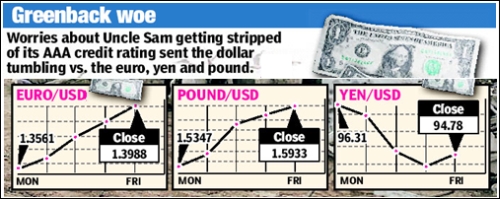
Source: New York Post, May 23, 2009.
As the implications of surging government debt levels move to center stage, the US Debt Clock makes for sobering reading. Click here or on the image below for the live version.
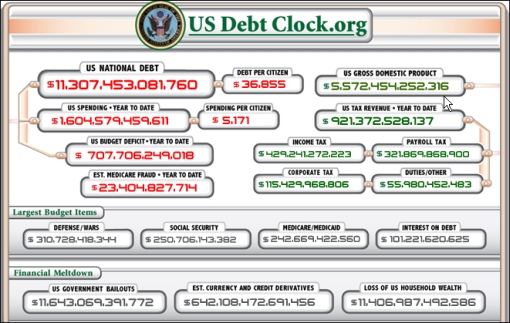
Source: US Debt Clock, May 23, 2009.
David Rosenberg, Merrill Lynch’s former chief North American economist, who has just commenced duty with buy-side firm Gluskin Sheff & Associates, commented as follows:
While the UK government debt-to-GDP ratio is around 40%, the rating agencies are looking at 100% in coming years. The US government debt/GDP ratio right now is near 65%, but clearly heading higher. It seems as though 100%+ is the trigger point for downgrades …
So the view out there that the US is about to receive a credit downgrade despite the dramatic expansion of the government balance sheet is a little premature. For now, it makes for nice cocktail conversation but as super-sized as the deficit is (13% of GDP), there is enough room in the debt ratio that the US would likely have to run three more years of this sort of fiscal policy to be seen as a candidate for a downgrade.
The performance of the major asset classes is summarized by the chart below. (Click to enlarge:)
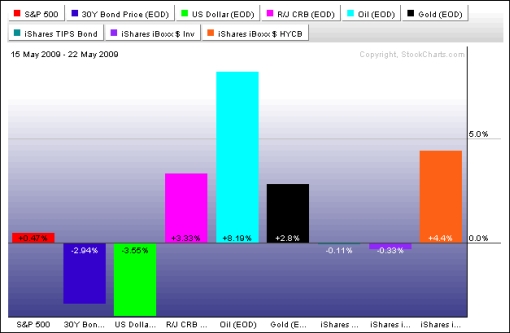
Source: StockCharts.com
Following the previous week’s bruising, the MSCI World Index last week gained 2.2% (YTD +2.3%) and the MSCI Emerging Markets Index 5.4% (YTD +31.6%).
Similarly, the major US indices reversed course, but in a much more subdued fashion, as seen from the fairly flat movements of the major indices: S&P 500 Index (+0.5%, YTD -1.8%), Dow Jones Industrial Index (+0.1%, YTD -5.7%), Nasdaq Composite Index (+0.7%, YTD +7.3%) and Russell 2000 Index (+0.4%, YTD -4.4%).
The Nasdaq remains the only major US index still in the black for the year to date, finding itself in the company of the majority of emerging and mature markets.
Click here or on the table below for a larger image.
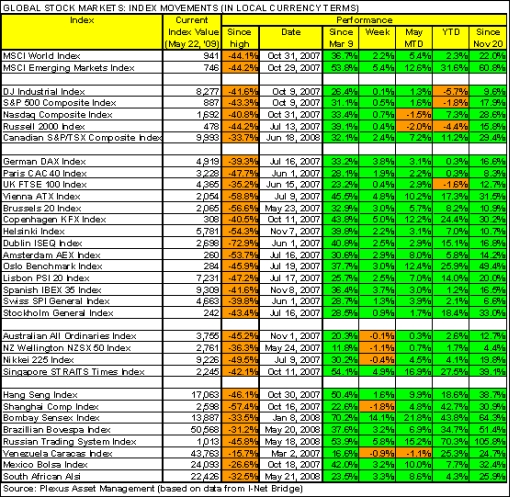
India’s BSE 30 Sensex Index (+14.1%) was the strongest market for the week, having rallied by 17.3% on Monday on unexpected election results. This was the biggest one-day gain in the 30-year history of the Index.
Elsewhere, returns ranged from top performers Sri Lanka (+12.5%), Cyprus (+12.3%), Luxembourg (+9.4%), Macedonia (+9.0%) and Nigeria (+8.8%), to Ghana (-8.9%), Malta (-1.2%), Palestine (-1.2%), Côte d’Ivoire (-1.1%) and Uganda (-1.1%), which experienced headwinds. Japan’s Nikkei 225 Average (-0,4%) put in the worst performance among the major markets. (Click here to access a complete list of global stock market movements, as supplied by Emerginvest.)
John Nyaradi (Wall Street Sector Selector) reports that as far as exchange-traded funds (ETFs) are concerned, Indian ETFs such as WisdomTree India Earnings (EPI) (+22.7%) and PowerShares India (PIN) (+21.6%) were going great guns. Other top-performing sectors were concentrated among commodity funds, helped by investors becoming less risk averse. Strong performers included MarketVectors TR GoldMiners (GDX) (+10.6%), United States Oil (USO) (+4.1%), and iShares Silver Trust (SLV) (+4.6%).
Conversely, safe-haven-related ETFs - US dollar and government bonds - and regional banks reacted negatively, with iShares Dow Jones US Regional Banks Index (IAT) declining by -5.3%, iShares 20+ Year Treasury Bond (TLT) by -4.8%, and PowerShares DB US Dollar Index Bullish (UUP) by -2.9%.
On the credit front, I updated my regular “Credit Crisis Watch” last week and concluded as follows:
In summary, the past few months have seen impressive progress on the credit front, with a number of spreads having declined substantially since their ‘panic peaks’. The TED spread (down to 0.48% from 4.65% on October 10), LIBOR-OIS spread (down to 0.45%% from 3.64% on October 10) and GSE mortgage spreads have all narrowed considerably since the record highs.
In addition, corporate bonds have seen a strong improvement, although high-yield spreads remain at elevated levels. Credit derivative indices for companies in all the major geographical regions have also shown a marked tightening since the November highs.
Most indications are that the credit market tide has turned on the back of the massive reflation efforts orchestrated by central banks worldwide and that the credit system has started thawing. However, although the convalescence process seems to be well on track, it still has a way to go before confidence in the world’s financial system returns to more ‘normal’ levels and liquidity starts to move freely again.
The quote du jour relates to the monetization process and belongs to Bill King (The King Report):
The dollar collapsed and inflation accelerated with Bernanke’s Treasury monetization. More monetization will yield higher inflation and a dollar debacle. The Fed, Treasury, administration and solons are being checked by the dollar and commensurate inflation … You can reference Jimmy Carter, G. William Miller, stagflation, dollar flight, the Misery Index and public revolt if you don’t believe us.
In other news, Treasury Secretary Timothy Geithner on Wednesday testified before the Senate Banking Committee, saying that “"here are important indications that our financial system is starting to heal”, and that the Treasury would soon be introducing its plan to team up with private investors to buy toxic assets from the banks. Separately, President Barack Obama on Friday signed into law a bill to put new restrictions on the credit-card industry, compelling card issuers to spell out their terms in fewer words - in plain English - and treat customers more fairly.
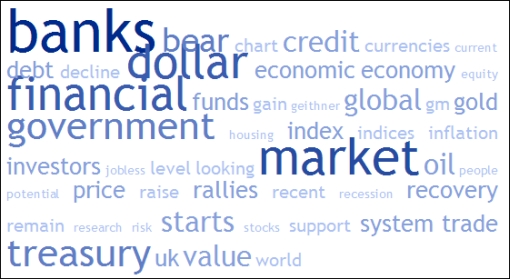
Next, a quick textual analysis of my week’s reading. No surprises here, with the word “banks” dominating the media. Strikingly, “dollar” is increasingly prominent as the greenback hit a five-month low.
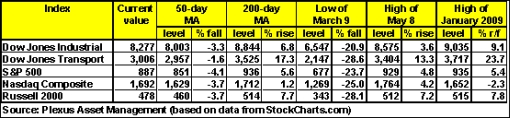
Back to the stock market. An analysis of the moving averages of the major US indices shows the spring rally having encountered resistance at the important 200-day line and/or the early January highs. The highs of May 8 are the most immediate target to the upside, whereas the levels from where the rally commenced on March 9 should hold in order for base formations to remain in force.
Click here or on the table below for a larger image.
For more about key levels and the most likely short-term direction of the S&P 500, Adam Hewison of INO.com prepared another of his popular technical analyses. Click here to access the short presentation. (The analysis was done on Wednesday with the Index at 912, but is still as relevant as it was a few days ago.)
Jeffrey Saut (Raymond James) said: "...our sense is the equity markets are forming at least a near- to intermediate-term TOP and we are cautious.
As Sy Harding writes
Our Seasonal Timing Strategy is now in its unfavorable season. Our non-seasonal Market Timing Strategy is now on a new sell signal. We remain on the recent buy signal for gold and remain neutral on bonds.
Indeed, over the past few weeks technology, retail, housing, and cyclicals have broken their relative strength uptrends that have been intact since the March lows. Whether this turns out to be just another shallow correction, or something more enduring, will likely be determined by those groups whose relative strength still remains intact. Such groups include financials, agriculture, chemicals, oil drillers, and emerging markets.
Speaking of stocks, with the Averages backing off from their thrust at the May highs, it’s clear (at least to me) that the market is having second thoughts about the picture,” said Richard Russell, venerable writer of the Dow Theory Letters.
My guess is that those thoughts have to do with the sliding dollar, the sinking bonds with their higher yields - and last but not least - the surging price of gold. Dollar down, bonds down, gold up, it all fits together - trouble.
For more discussion about the direction of stock markets, also see my recent posts “Gold bullion glitters brightly“, “Video-o-rama: Wall Street slumps on economic worries” and “Credit Crisis Watch: Thawing - noteworthy progress“. (Also, Donald Coxe’s webcast has been updated for May 22 and makes for good listening. This can be accessed from the sidebar of the Investment Postcards site.)
Economy
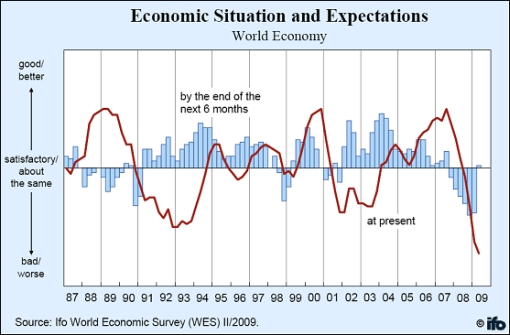
The Ifo World Economic Climate Indicator also rose in the second quarter of 2009 for the first time since autumn 2007. According to the Survey:
The rise in the indicator was the result of more favorable expectations for the coming six months; the assessment of the current economic situation, however, worsened again, falling to a new record low.
Economic expectations have improved in all major regions, especially in North America and Asia. But the expectations for the coming six months for Western Europe, Central and Eastern Europe, Russia and Latin America are also clearly upwards.
Click to enlarge:
Turning to the US, a snapshot of the week’s economic data is provided below. (Click on the dates to see Northern Trust’s assessment of the various data releases.)
May 22
• Road map for the near-term performance of the economy
May 21
• Index of Leading Indicators signals improving economic conditions
• Auto industry events will continue to distort jobless claims data
May 19
• Plunge in multi-family starts conceals small gain of single-family units
May 18
• Homebuilders Survey records improvement; will new home sales follow?
• Discount window borrowing continues to trend down
The chart below shows the Conference Board’s Leading Economic Indicator, which rose 1% month over month and is comparable to the increases seen at the end of the last recession.
Click to enlarge:
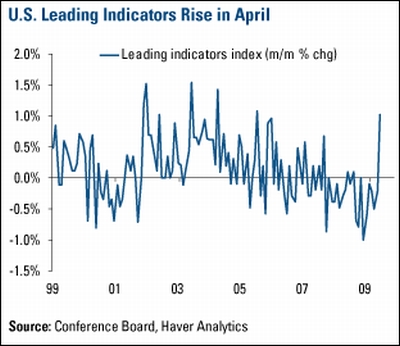
Source: US Global Investors - Weekly Investor Alert, May 22, 2009.
According to Moody’s Economy.com, the minutes from the Federal Open Market Committee’s meeting late in April indicate that participants were more optimistic about the economy than they had been at their previous meeting in mid-March. While the economy remained in recession, there were numerous signs that the pace of contraction was slowing down. Moody’s Economy.com said:
FOMC members agreed that the steps the committee had previously taken appeared to be providing an economic stimulus and that the Federal Reserve should continue with its previously announced policy actions, in particular ‘quantitative easing’, an expansion of the Fed’s balance sheet through the purchase of longer-term Treasuries, designed to bring down long-term interest rates.
Gallup’s latest Consumer Mood poll, dealing with economic and market implications, shows that only 6% of Americans have a “positive” mood on the economy, but that the percentage of those that are ”negative” has dropped significantly since early March when the stock market advance started. Also, Americans whose mood is described as “mixed” have increased from the mid-teens to 36% as the negativity has subsided.

Source: Gallup Daily: Consumer Mood, May 22, 2009.
This ‘mixed’ mood goes along with the ‘green shoots’ theory that some things are getting better and most things have stopped getting worse,” said Bespoke. “With Americans moving from ‘negative’ to ‘mixed’ before turning ‘positive’, does this imply that we’ll have a U-shaped recovery instead of a V?
The last quote comes from Nouriel Roubini, via a Facebook status update: “The Green Shooters are starting to sweat and getting cold feet as evidence of pestilent yellow weeds is mushrooming.”
Week’s economic reports
Date | Time (ET) | Statistic | For | Actual | Briefing Forecast | Market Expects | Prior |
May 19 | 8:30 AM | Apr | 494K | 530K | 530K | 511K | |
May 19 | 8:30 AM | Apr | 458K | 525k | 520K | 525K | |
May 20 | 10:30 AM | Crude Inventories | 05/15 | -2.10M | NA | NA | -4.63M |
May 20 | 2:00 PM | FOMC Minutes | 04/29 | - | NA | NA | NA |
May 21 | 8:30 AM | 05/16 | 631K | 620K | 625K | 643K | |
May 21 | 10:00 AM | Apr | 1.0% | 0.7% | 0.8% | -0.2% | |
May 21 | 10:00 AM | Philadelphia Fed | May | -22.6 | -18.0 | -18.0 | -24.4 |
Click here for the week’s economy in pictures, courtesy of Jake of EconomPic Data.
Source: Yahoo Finance, May 22, 2009.
The US economic highlights for the week include the following:
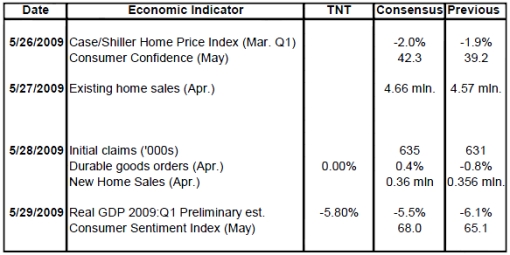
Source: Northern Trust.
Click here for a summary of Wachovia’s weekly economic and financial commentary.
Markets
The performance chart obtained from the Wall Street Journal Online shows how different global financial markets performed during the past week.

Source: Wall Street Journal Online, May 22, 2009.
Louis Pasteur said: “Chance favors the prepared mind.” Hopefully the “Words from the Wise” reviews will assist Investment Postcards readers with the ongoing preparation that is required to manage your money wisely.
I hope you’re enjoying a great Memorial Day holiday weekend.
