投資日記
投資心得


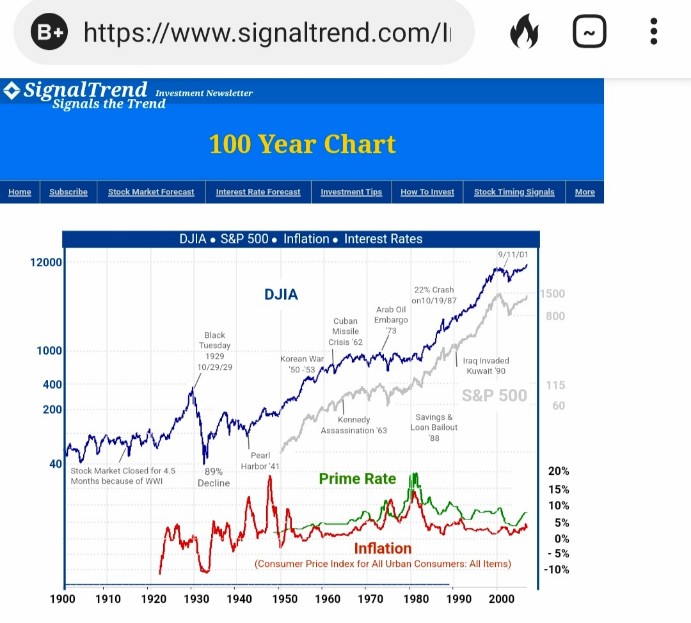
Apparently the chart does not show this year's data. I would like to mention that an economic crisis worse than that of 1929 (89% decline of the market) is possible in the near future. Let us review what caused the 1929 crash.
First of all, market is overheated before the crash. The Dow increased six-fold from August 1921 to September 1929. How much Nasdaq was increased in the last ten years? Also about 6 times. Second, high inflation and fast interest rate hike. Sounds familar? Furthermore, the Great Depression began with the stock market crash of 1929 and was made worse by the 1930s Dust Bowl, name for both the drought period in the Great Plains that lasted from 1930 to 1936. Do you know that the Mississippi River water levels plummet to all-time lows since the record available in 1954? What does it mean for US economy? High inflation will probally persists since low water level not only means reduced agricultural output but also higher transportation cost. Everyone is feeling the pain in grocery shopping now and things could be worse in the future.
Last but not the least, I am not hoping such bad thing will happen in the near future even though I am bearish to the market. We can hope for the best, but need to prepare for the worst. Just my two cents. YMYD.