


Valuation metrics have always been somewhat subjective and open for interpretation. Such is their nature. Here are some reasons why a historically high P/E may not be a major cause for concern yet.
Historically Low Interest Rates
From a valuation perspective, it’s intuitive to think that somewhat higher valuations arising from a lower discount rate are justified, as investors are more willing to pay a higher price for more valuable future earnings. But to what extent?
After nearly a decade of interest rates near-zero, maybe the way valuations are viewed should be different. Sure, the Fed has been embarking on a tightening cycle over the past two years, with the fourth such rate hike having occurred in June, but yields still remain near historic lows.
Relative to other periods over the previous forty years, higher valuations have occurred during periods with higher interest rates. The current P/E ratio is only about 14% richer than what the average was during the last economic expansion from 2001-2007. And yet yields were twice as high (4-5% back then versus the current 2.38% on the 10-year U.S. Treasury). Similarly, higher valuations occurred both in the early and late 90s, during environments when yields were 2-3x higher than today’s levels.
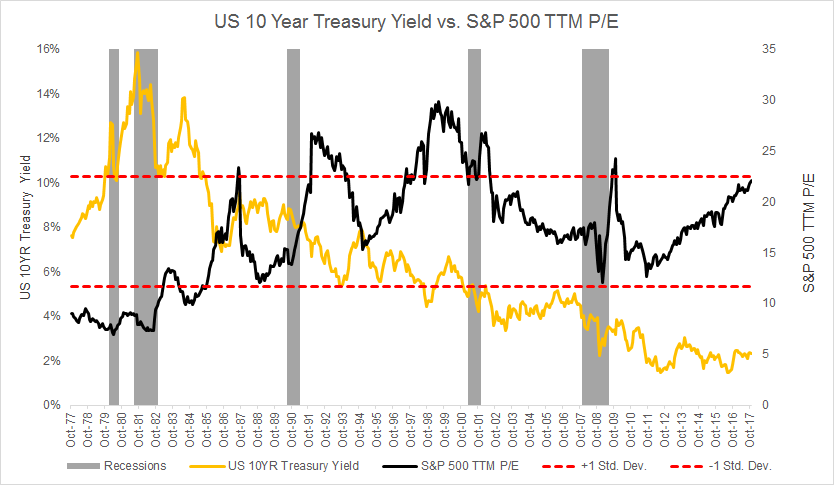
Source: Data from Bloomberg as of November 28, 2017; proprietary chart
The other side of the coin is that lower yields make competing investments such as bonds less attractive. With the current 10-year Treasury paying 2.38%, it’s no surprise that investors hungry for higher returns may opt for equities. This notion is even more pronounced from a global perspective, where 10-year Bunds and Japanese bonds yield just 0.388% and 0.04%, respectively. Of course, from a domestic investor perspective, this was an even stronger argument before the backup in yields began in the summer of 2016 when 10-year was hovering at levels below 1.4%. If anything, the current rising rate environment remains a sweet spot for the relative trade-off between stocks and bonds. Historically, stock performance has generally not been negatively impacted by rising rates until the yield on the 10-year reaches approximately 5% - over 2x higher than today's level.
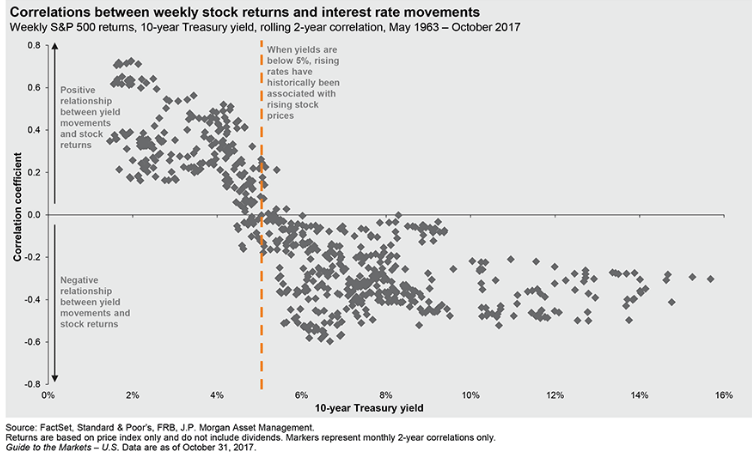
Source: J.P. Morgan Asset Management - "Guide to the Markets" as of October 31, 2017
Inflation
Since interest rate levels reflect the rate of inflation, it is worthwhile to note the relationship between the P/E ratio and inflation. High P/Es have been associated with low levels of inflation (1-4%) historically. This can likely be attributed to the fact that lower levels of inflation generally correspond with corporate earnings growth and slowly rising rates; similar to the environment today. In the absence of strong inflationary pressures, it is also reasonable to expect low rates to persist and therefore the prices of stocks, as well as other assets, to rise. Furthermore, if the earnings growth rate continues to run at a level above any rise in rates, multiples can press higher.
 Source: Data from Bloomberg as of November 28, 2017; proprietary chart
Looking Under The Hood Of The CAPE
The Shiller P/E ratio is the price-to-earnings ratio that is based on the average inflation-adjusted earnings from the previous 10 years, also known as the Cyclically Adjusted P/E Ratio (CAPE Ratio). Dr. Shiller’s data goes back to 1881. Even with this lengthy period under consideration, the ratio has only been higher than its current level 3.2% of the time, or 52 out of the 1,643 monthly data points. Needless to say, the current valuation looks extended.
The current ratio (31.3) is, however, pulling data from as far back as November 2007 - just a few months after earnings data began to decline; ultimately reaching their bottom in March 2009 (in real terms). What this means is that the denominator is accounting for the very low aggregate earnings data that occurred for the duration of the last crisis, which has depressed the data point. This includes 14 months of aggregate real earnings data below $50 (October 2008 – November 2009). This contrasts with current earnings of $105.23 and a streak of real earnings data above $89 for the past 77 months.
The question then becomes what this metric would look like once these early months begin to roll off the data set, and are replaced with much higher current earnings data. Chopping off the first two years of earnings from the calculation, for example, provides a P/E of 27.5; about 12% lower than the current ratio. Ergo, if earnings continue to trek higher it is possible that the ratio can actually decline, or at least remain steady at its current level while prices continue to rise (as it did during the 2004-2007 expansionary period). A similar argument can be made for the traditional trailing-twelve-month ratio.
Looking Forward
In summary, high P/E ratios in a vacuum are not a doomsday predictor, but they still matter. The unique characteristics of the current environment, however, likely should change the way we look at the valuation metric for now.
Certain macro factors at play, such as historically low interest rates, are one difference. The relative attractiveness of stocks given their higher dividend yield compared to bonds, as a result of very loose monetary policy, has pushed P/Es higher. Couple this with subdued inflationary pressures, and this could carry on for some time still.
From a historical perspective, the trailing P/E ratio is still just under one standard deviation from its mean going back over the past 40 years, to 1977. The metric has been higher than its current value approximately 20% of the time since 1977. Similarly, the forward P/E is also just below its one standard deviation point, with data since 1990. The forward metric has been higher than its current value approximately 17% of the time. So although the metrics are near their highest levels, they have been higher.
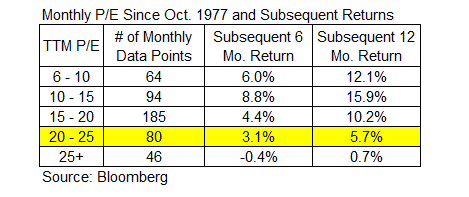
What the historical data does clearly show, however, is that higher current valuation levels do tend to correspond with low future financial returns. Analyzing the data since October 1977 shows that, on average, P/E ratios in the range of 20-25 generally correspond with a subsequent 12-month return of ~5.7%; echoing sentiment by Vanguard recently, which told investors to expect no better than 4 percent to 6 percent returns from stocks in the next five years.
Disclosure: I/we have no positions in any stocks mentioned, and no plans to initiate any positions within the next 72 hours.
I wrote this article myself, and it expresses my own opinions. I am not receiving compensation for it (other than from Seeking Alpha). I have no business relationship with any company whose stock is mentioned in this article.
