


This is a pretty simple article. Momentum stocks are strongly outpacing the broader stock market in 2017. Momentum stocks, as proxied by the MSCI USA Momentum Index, replicated by the popular exchange traded fund the iShares Edge MSCI USA Momentum Factor ETF (MTUM), have posted nearly a 34% total return in 2017.
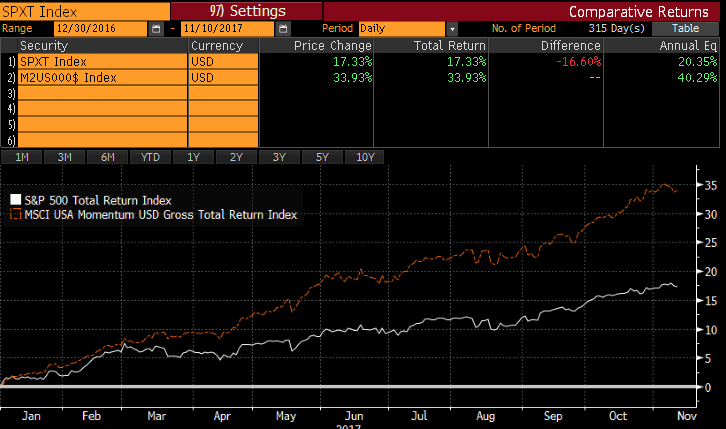 Relative to the S&P 500 (SPY), this is the strongest outperformance by momentum stocks since 2007 when momentum stocks outperformed the S&P 500 by 12.3%. That sharp outperformance in 2007 was the largest relative gain since 1998 and 1999. We know what happened after these two periods, the two largest stock market corrections in recent memory - the bursting of the tech bubble and the Global Financial Crisis.
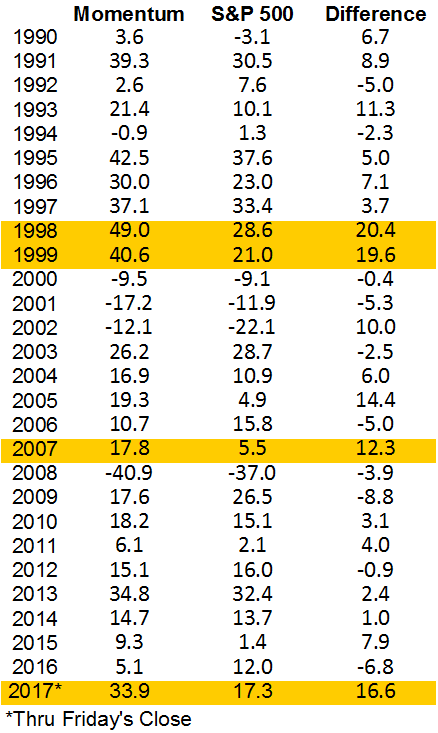 Anytime you invoke 2007 as a market parallel, there is reason for investors to be skittish. Some may counter that the current market environment parallels more with 2005 when momentum also strongly outperformed outpacing the S&P 500 by 14.4%. The S&P 500 had another 20% to run after that period. As detailed in my recent article "VIX Record," 2005 was the beginning of an extended low-volatility regime. With equity volatility recently recording new lows, a sharp change to a high vol environment would be rather unprecedented.
Similarly, anytime you invoke the 1998-1999 period as a market parallel, there is reason for investors to also be skittish. The momentum index today is heavily dominated by information technology stocks, which comprise 35% of the index (as opposed to 25% in the S&P 500). While I do not have historical constituent data for the Momentum Index, it assuredly had an outsized exposure to tech stocks in the late stages of the tech bubble. Are tech stocks primed for underperformance, or are they simply a canary in the coal mine for a broader market correction?
I thought this would be an interesting source of discussion for Seeking Alpha readers. My take is that this relationship between Momentum and the broader market gauge suggests some parts of the market have perhaps rallied too far. With synchronous global growth, still supportive monetary policy, and expectations for solid earnings growth, it does not appear that domestic markets are primed for a sharp correction like we saw in 2000 and 2008.
Years of strong gains and a gradually tightening Federal Reserve could signal that forward returns will not be as robust. Volatility, based on its historical record, has only one direction to go, and should move higher over time. Risk-adjusted returns may be weaker prospectively, but I do not view this Momentum relationship as a harbinger for a crash.
Disclaimer: My articles may contain statements and projections that are forward-looking in nature, and therefore, inherently subject to numerous risks, uncertainties and assumptions. While my articles focus on generating long-term risk-adjusted returns, investment decisions necessarily involve the risk of loss of principal. Individual investor circumstances vary significantly, and information gleaned from my articles should be applied to your own unique investment situation, objectives, risk tolerance and investment horizon.
Disclosure: I am/we are long SPY,MTUM.
I wrote this article myself, and it expresses my own opinions. I am not receiving compensation for it (other than from Seeking Alpha). I have no business relationship with any company whose stock is mentioned in this article.
Wow! Very interesting. Have you been using this to trade/invest?
doing much better than spy yet not being that much more volatile so I added a bit bonds to "further calm it" and viola you have it. i'm seriously considering putting my $ into this etf.
