博主喜歡熱鬧
自娛樂


'Trexit' Bounce: Where To Find Opportunities, What To Watch
Market Review and Update
Let me pick up with where I left off last week:
“This past week that support gave way leading to the first 9-day straight decline in the index since 1980.
However, as I explained during the “Real Investment Hour”on Thursday, it is never advisable to “panic sell” when a break of support occurs. This is because that by the time you have an extended period of selling, the markets tend to be oversold enough for a short-term reflexive bounce to rebalance portfolio risk at better levels.
The chart below is a daily chart [of the S&P 500] showing the market currently bouncing off support at the 200-dma combined with a 3-standard deviation move from that short-term moving average. This all suggests a reflexive bounce from oversold conditions is extremely likely.”
Well, following a 700-point plunge during election night on Tuesday, rally we did.

Last week, I detailed the various levels of overhead resistance to any rally that must be defeated to reinstate a more bullish market.
- The downtrend resistance from the previous highs is colliding with the previous support level which now acts as important resistance.
- The 50-dma is also trending downward adding further resistance to price advances in the near-term.
- An important “sell signal” has been registered at fairly high levels and current remains intact.
The post “Trexit” rally that started on Wednesday took out the first two levels of resistance with some ease. However, the “sell signal” remains intact with the market now back to extreme oversold levels as shown by the red circles at the top of the chart.
The good news is the market is holding above the downtrend resistance line currently which puts all-time highs as the next logical point of attack if this bull market is to continue.
However, is we step back to a longer-term (weekly) picture we get a little clear picture about the overall directional trend of the market.

I like weekly charts because the “noise” of daily volatility in price action is removed. As shown in the chart above, the “sell signal”remains intact but, as opposed to the daily chart previously, the reflexive move has only taken stocks back to retest the underside of the longer-term bearish “downtrend” line.
This suggests the current move may be near its limits and the short-covering frenzy seen on Wednesday and Thursday of this past week is near completion. As I stated last week:
“As shown, the sell signals that are currently being registered in the market have typically suggested further deterioration in the markets to come. This supports the idea that any reflexive bounces, particularly post-election next week, should be used to rebalance portfolio risk accordingly.”
That advice seems salient once again this week.
4-Standard Deviations Ain’t Sustainable
Standard deviation is a statistical term that measures the amount of variability or dispersion around an average. Standard deviation is also a measure of volatility. Generally speaking, dispersion is the difference between the actual value and the average value. The larger this dispersion or variability is, the higher the standard deviation. The smaller this dispersion or variability is, the lower the standard deviation. Chartists can use the standard deviation to measure expected risk and determine the significance of certain price movements.
This assumes, of course, that price changes are normally distributed with a classic bell curve. Even though price changes for securities are not always normally distributed, chartists can still use normal distribution guidelines to gauge the significance of a price movement. In a normal distribution, 68% of the observations fall within one standard deviation. 95% of the observations fall within two standard deviations. 99.7% of the observations fall within three standard deviations. Using these guidelines, traders can estimate the significance of a price movement. A move greater than one standard deviation would show above average strength or weakness, depending on the direction of the move.

Furthermore, since prices can only move, or deviate, within a limited range from their moving average, this analysis can help determine the extent to which a move is completed.
The move following the election took the Dow Jones Industrial Average to 4-standard deviations of its moving average. A feat that has only been rarely witnessed previously and has been coincident with short to intermediate-term corrections or worse.

This suggests the massive short covering rally following the election may have run its course and we will once again be forced to return our focus back to Fed rate hikes, earnings, and economics. The problem, of course, is those points don’t support asset prices at current levels.
Breadth, as I will discuss in a minute, also remains an issue. As Dana Lyon’s pointed out this past week:
“Too many highs and lows, the stock market has generally not fared too well in the intermediate-term following these instances. It hasn’t been unanimous. Some of the occurrences in the mid-80′s and mid-90′s saw the market keep moving higher without a hiccup. However, below-average returns were certainly the norm. Here are some of the numbers.”

“So obviously the number of NYSE New Highs and New Lows is relatively elevated. However, as the next data point shows, the level of New Highs and Lows is elevated on an absolute basis as well. To wit: Yesterday saw both the number of NYSE New Highs and New Lows account for more than 5% of all issues traded. That is another rare occurrence, with just 11 precedents since 1970.”


“As the table shows, the return in the S&P 500 has been negative 2 months after all 11 occurrences. And it wasn’t just the 2-month period that was poor. Median returns are negative across nearly all time frames from 1 week to 2 years. The 2-year result is perhaps the most eye-opening after the 2-month. The market is not typically down over a 2-year period so to see 7 of the 8 instances lower is a rare result.”
While I went through each sector last week, I need to run through them again to show you where the rally did, and did not, occur.
Sector By Sector
I have modified the charts from last week to include 2,3 and 4 standard deviations from the 50-day moving average. I think you will find some of these charts quite interesting.
ENERGY
The energy sector (via Energy Select Sector SPDR (NYSE:XLE)) is closely tied to the underlying commodity price of oil. Given the ongoing structural dynamics of the commodity, there is still an unrealized detachment between energy sector fundamentals and the markets.
Over a month ago, I warned the OPEC agreement would fail and oil prices would once again approach $40. There is still more correction to occur in this sector so underweight energy exposure remains advised for now.

However, energy stocks did bounce, as expected, from their oversold lows but the move looks complete for now. Downside risk remains, so caution is advised.

HEALTH CARE
As I stated last week:
“The healthcare sector has been a laggard as of late and has broken down through the bullish trend. With the sector very oversold, there is a reasonable risk/reward setup in the short term for this sector.”
That move came quickly with the majority of the move now completed (via Health Care Select Sector SPDR (NYSE:XLV)). Look for pullbacks or consolidations to add trading exposure at this point. There is a lot of uncertainty going forward based on the outcome of the Affordable Care Act, so long-term investors should be cautious as premiums being paid in many areas are still exceptionally elevated.

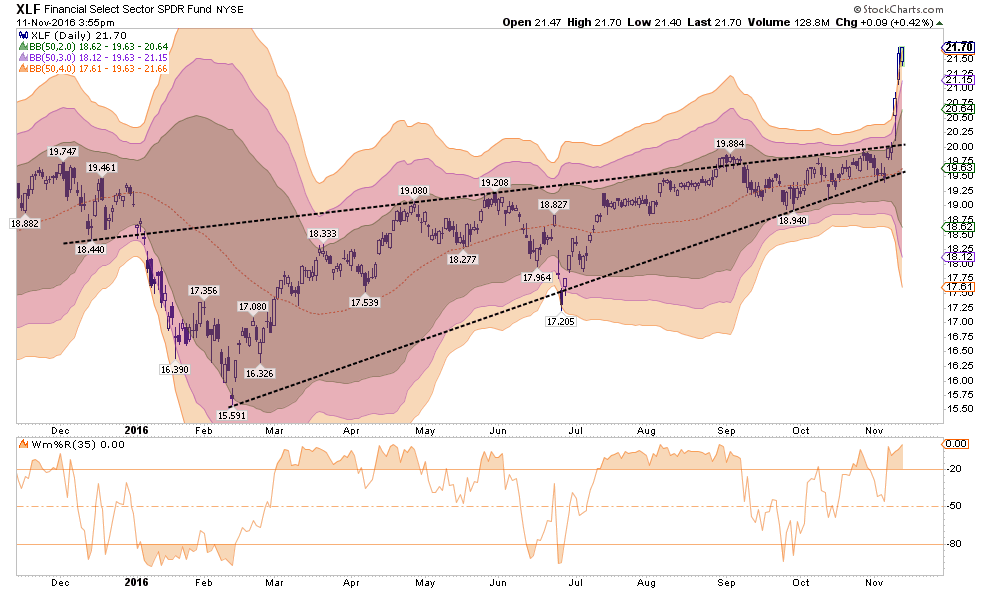
FINANCIALS
Last week:
“Financials continue to be a laggard with respect to overall relative performance, however, the bullish trend line remains intact for now. I suspect this will give way during the continuation of a market correction and a deeper decline will likely occur. I continue to recommend an underweighting of the sector in portfolios for now.”
Well, that was certainly not to be the case as talk of a repeal of Dodd-Frank sent financials (via Financial Select Sector SPDR (NYSE:XLF)) into orbit. At 4-standard deviations above the mean, the move is likely complete for the time being so serious profit taking is advised. Look for the sector to reverse and consolidate before rebalancing the position to target allocations in portfolios.
INDUSTRIALS
Last week:
“Industrial stocks, because of the dividend yield, have been a big beneficiary of the ‘yield chase.’ However, this sector is directly affected by the broader economic cycle and with expectations ahead of fundamental realities, risk is high. While the sector continues to hold onto support, I would recommend a reduced exposure to the sector for now until the overall broader market repairs itself. Stops should be placed at the current support level.”
Of course, the election of Trump also means a potential for infrastructure spending which gave a lift to the sector (via Industrial Select Sector SPDR (NYSE:XLI)). However, like financials, the move is extreme. Take profits and reduce weightings until a correction and consolidation occurs.

MATERIALS
Same as with industrials, and all for the same reasons (via Materials Select Sector SPDR (NYSE:XLB)).

UTILITIES
As opposed to the moonshots by Materials, Industrials, and Financials, the Utilities sector (via Utilities Select Sector SPDR (NYSE:XLU)) is pushing extreme oversold levels. There is a reasonable trading opportunity in Utilities which will coincide with a reversion in interest rates and a rotation within the overall market.

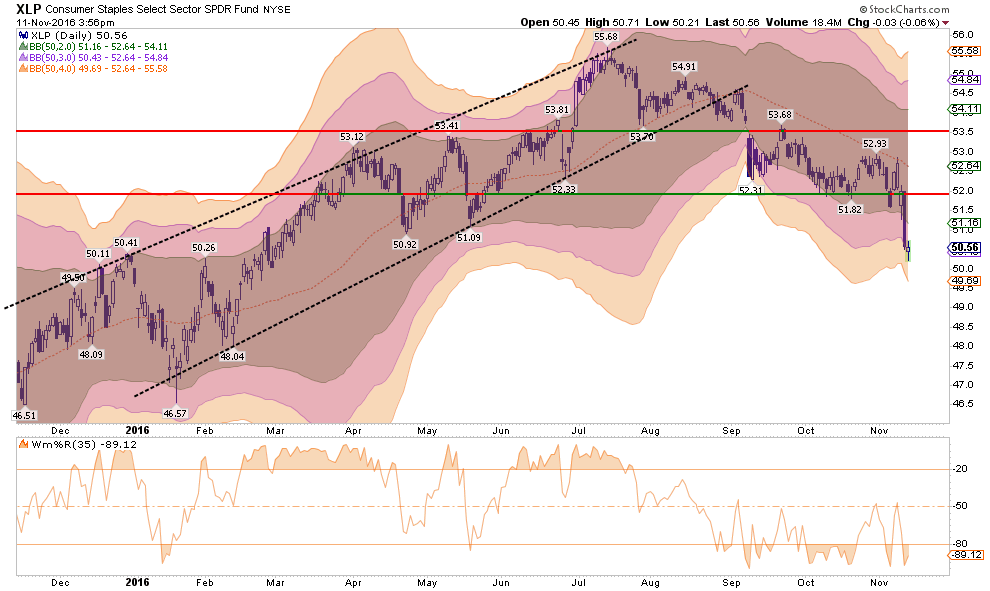
STAPLES
As with Utilities, the Staples sector (via Consumer Staples Select Sector SPDR (NYSE:XLP)) has also reached extreme oversold levels. These extremes tend not to last long and are good trading opportunities. This does NOT mean these sectors are ripe for a long-term move so caution is advised.
DISCRETIONARY
As discussed with Staples above, the Discretionary sector (via Consumer Discretionary Select Sector SPDR (NYSE:XLY)) had reached very oversold levels last week and hopes of a stronger economic recovery under a Trump administration gave the sector a boost. The sector is currently running into heavy overhead resistance, so trading positions should be watched closely.

TECHNOLOGY
As I stated last week:
“The Technology sector has been the “obfuscatory” sector over the past couple of months. Due to the large weightings of Apple (NASDAQ:AAPL), Google (NASDAQ:GOOGL), Facebook (NASDAQ:FB), and Amazon (NASDAQ:AMZN), the sector kept the S&P index from turning in a worse performance than should have been expected.
The sector is oversold and very close to breaking important support levels. Weighting should be moved to underweight and stops set just below current support.”
That advice turned out well as technology broke support and headed lower to extreme oversold levels (via Technology Select Sector SPDR (NYSE:XLK)). For now, be cautious as the longer-term bull trend has been broken. Use rallies back to the trend to reduce exposure to the sector.

EMERGING MARKETS
From last week:
“Emerging markets have had a very strong performance during the summer but remain in a longer-term downtrend. The strengthening of the US dollar has started to weigh on the sector and will only get worse the longer it lasts.While the sector is oversold, the majority of the gains in the sector have likely been achieved. Profits should be harvested and the sector under-weighted in portfolios. Long-term underperformance of the sector relative to domestic stocks continues to keep emerging markets unfavored in allocation models for now.”
That advice remains the same this week as the dollar continues to strengthen under a perceived resurgence in economic growth in the U.S. The sector (via iShares MSCI Emerging Markets(NYSE:EEM)) IS extremely oversold, however, use rallies to reduce exposure to emerging markets. The continued strength of the U.S. dollar will continue to negatively impact emerging markets. “Trump’s Wall” also does not bode well for Mexico as one of their top-5 inputs into GDP is remittances from the U.S.

INTERNATIONAL MARKETS
As with Emerging Markets, International sectors also remain unfavored in allocation models (via iShares MSCI EAFE (NYSE:EFA)). The long-term downtrend remains intact and is currently very overbought. Underweight the sector, take profits, and focus more on domestic sectors for now.

DOMESTIC MARKETS
From last week:
“The S&P 500 is now oversold on a very short-term basis and is sitting on top of the 200-dma. However, with longer-term sell signals in place (bottom section of chart) a further decline is likely following a reflex bounce. With the markets failing repeatedly at the 50-dma, the corrective process is likely not over as of yet. Caution still advised for now.
The “Trump rally,” as stated at the beginning this missive, did resolve the resistance at the 50-dma. However, the downtrend and overall corrective process remains intact currently. With the market back to an extreme overbought condition, this is a good opportunity to rebalance portfolios and reduce risk in sectors that have gotten extremely ahead of themselves.

SMALL CAP
Small cap stocks (via S&P 600) have been grossly underperforming the broader market as economic and earnings weakness tends to show up in these smaller capitalization companies first. While the economic and earnings backdrop have not changed, short-covering caused small-caps to reverse from extremely oversold to overbought in the course of just three days. Take profits and rebalance sector weightings accordingly.

MID-CAP
As with small cap stocks above, mid-capitalization companies (via S&P Midcap 400) also responded to the short-covering “feeding frenzy” over the last three days. While not as overbought as small-caps currently, the same advice of rebalancing remains as the economic and earnings backdrop remains a concern.

REITs
REITs have been under a tremendous amount of pressure in recent weeks due to the rise in rates (via Vanguard REIT ETF (NYSE:VNQ)). However, with interest rates now EXTREMELY overbought, the risk-reward setup to add REITs to portfolios is positive. Positions can be added, underweight for now, with stops set at $77.

Overall, the market back drop is very fragile and narrow. A few sectors have pushed the overall market higher, but now those sectors are pushing extreme conditions. Opportunities exist in the beaten down sectors which should see a benefit from sector rotations during a “risk off” transition in the market.
Importantly, despite the optimism the markets exhibited following the Presidential election, there is a long, long way to go before we see ANY policy changes and even a longer period before we see any actual results. The markets have gotten quite a bit ahead of themselves currently as earnings remain weak, a stronger dollar and higher rates will weigh on economic growth and the current bull market is extremely extended.
So, caution remains advised for now. Let’s give the market another week to shake itself out before we start making any drastic changes. This will allow us to make sure we aren’t being “head faked” into making an emotionally driven investment mistake.
THE MONDAY MORNING CALL
The Monday Morning Call – Analysis For Active Traders
Why I Am Buying Bonds (For A Trade)
Over the last three weeks, I have been selectively buying bonds into portfolios as opportunities have presented themselves.Importantly, I am buying ACTUAL bonds, not bond funds or ETFs, so the rise in rates over the last week is not important to my holding period return or my return of principal.
However, the spike in rates this past week, now has me buying bond ETFs for a trading opportunity. As shown below, interest rates are now pushing overbought conditions only seen near absolute peaks in interest rates movements. (Orange circles)

What is interesting is that stock buyers are told to buy stocks after big corrections, yet it works EXACTLY the same way with bonds. When interest rates spike, bonds become VERY oversold and operate on exactly the same premises as stocks.
So, bonds are now EXTREMELY oversold and this is as good of an opportunity as one will get to buy bonds.
Does this mean rates will plunge on Monday? No. Rates could go a bit higher from here, but it will likely not be much. As Jeff Gundlach stated last week:
“I do think this rate rise is about 80% through. If yields rise beyond ‘critical resistance’ levels, including 2.35% on the 10-year note, then things are in really big trouble.”
He is right, higher rates negatively impact economic growth. But in BOTH CASES, the outcome for bonds is EXCELLENT.
The chart below shows the long-term trend of the 10-YearTreasury going back to 1978 as compared to its RSI index.

Whenever the RSI on rates has exceeded 80%, red dashed lines, it has preceded a subsequent decline in rates. In other words, overbought rates are a signal to buy oversold bonds for a potential reversion trade.
As I have repeatedly written in the past:
“While the punditry continues to push a narrative that ‘stocks are the only game in town,’ this will likely turn out to be poor advice. But such is the nature of a media driven analysis with a lack of historical experience or perspective.
From many perspectives, the real risk of the heavy equity exposure in portfolios is outweighed by the potential for further reward. The realization of ‘risk,’ when it occurs, will lead to a rapid unwinding of the markets pushing volatility higher and bond yields lower.”

“This is why I continue to acquire bonds on rallies in the markets, which suppresses bond prices, to increase portfolio income and hedge against a future market dislocation.
In other words, I get paid to hedge risk, lower portfolio volatility and protect capital. Bonds aren’t dead, in fact, they are likely going to be your best investment in the not too distant future.
In the short-term, the market could surely rise. This is a point I will not argue as investors are historically prone to chase returns until the very end. But over the intermediate to longer-term time frame, the consequences are entirely negative.
As my mom used to say: ‘It’s all fun and games until someone gets their eye put out.’”
So, yes, from a trading perspective, one of the “most unloved”asset classes to own currently – bonds.
