


We all know how hot energy as a whole has been, but even the staunchest bulls still need to choose carefully, with share price performance over the past year in this sector having ranged from minus 87 percent for Cheniere Energy (LNG) to plus 650 percent for Gran Tierra Energy (GTE). ETFs help -- energy ETFs in existence for a year produced an nice average price gain of about 30 percent. But there's room for do-it-yourselfers to do better.
A challenging sector
Those who are accustomed to using quantitative rules-based approaches to stock selection, such as screens or multi-factor rankings, know how productive such strategies can be. But when we try to apply such concepts to a situation like energy, where stocks seem to move on news rather than fundamentals, models often break down.
Figure 1 presents the results of a performance test of a company-quality rank I created on portfolio123.com. It's a very simple model that considers return on investment, asset turnover, and long-term debt.
Figure 1
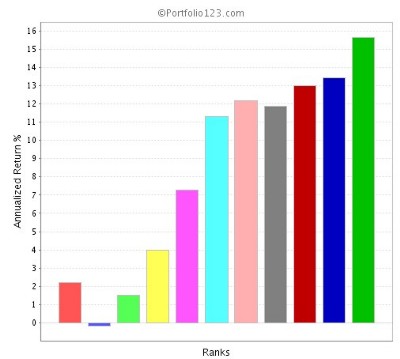
The entire stock universe is divided into 10 groups. The dark green vertical bar to the far right represents the annualized performance of the best group, the highest ranked stocks. The second (dark blue) bar from the left depicts the performance of the worst group. The red bar all the way to the left represents the S&P 500.
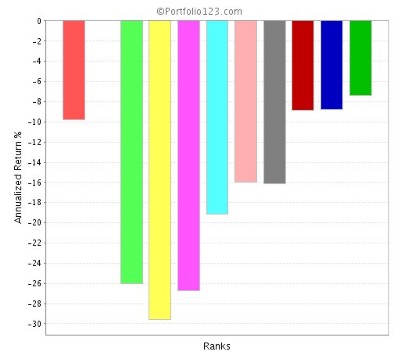
We see that the system isn't perfect, but that on the whole, gravitating toward the highest ranked stocks and avoiding those with the lowest ranks would have enhanced our probability of success during the test period. Figure 2 shows that the system would have been even more helpful during the challenging market conditions we've been experiencing since 6/23/07. I wouldn't suggest getting rich by emphasizing high ranked stocks, but avoiding lower ranked issues could have helped steer us away from some of the market's worst performers.
Figure 2
Look now at Figure 3, which shows what happened to our ranking system's performance since last June when we limited consideration to Energy stocks.
Figure 2
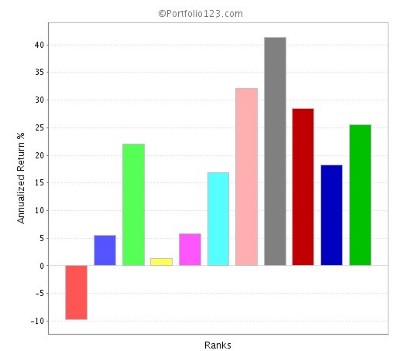
All bars except the one that represents the S&P 500 face upward, reflecting the general strength among energy stocks. But the pattern of gains from group to group is erratic enough to make it clear that the company-quality rank I created which seemed so promising for stocks in general is essentially useless when seeking energy stocks.
Try, try again — and succeed
Qualitative factors (competition, product quality, management talent, and so forth) are relevant to the analysis of any company, but rules-based investing tends to work because it's usually hard to judge the aforementioned factors, and others like them, successfully enough and consistently enough to produce better results than one can get through a more disciplined analysis of fundamentals. Energy, however, seems different. With oil, for example, those who can tune into the quality of a company's reserves (where they are, how much it costs to get them out of the ground), its production strategy, how it goes about replacing reserves, and so forth, are better positioned for investment success.
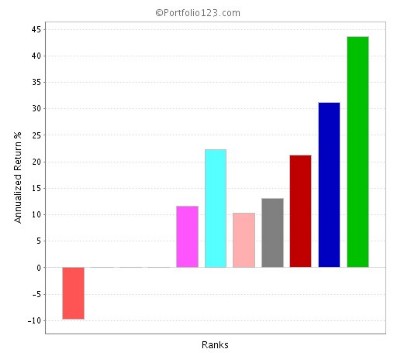
It's hard for the average investor to get much of handle on matters such as these, at least not for more than a small handful of companies. But it is possible to ride along with the opinions of Wall Street analysts who delve more closely into factors like that. They're not necessarily right all the time — ranks I created based on energy analyst recommendations were not fruitful. But they are closer to the scene and they are constantly fine-tuning earnings expectations along these lines. A ranking system based on the progress of those expectation, as reflected in estimate revision, worked reasonably well. Figure 4 shows how it performed on energy stocks from 6/23/07 through 6/14/08.
Figure 4
Building an energy portfolio
Using portfolio123.com's screener and backtester, I got good results when I identified energy stocks with market capitalizations at or above $250 million and estimate revision ranks at or above 90 (meaning I was picking the top 10 percent). But the number of stocks that turned up in each four-week test period was high; if i were to use the screen right now, I'd have to deal with 138 stocks.
I returned to the backtester and limited each period's result set to the 25 highest ranked stocks. The result actually improved. In Figure 5 below, the green line represents the performance of the stocks that made the screen's top 25 (the list was refreshed every four weeks) and the blue line represents the S&P 500.
Figure 5
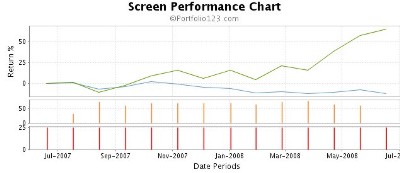
The above results, a one-year 64.8 percent gain for the screen versus an 11.9 percent drop for the S&P 500, do not include the impact of commissions or price slippage. So I ran the model through the portfolio123.com simulator, assuming an initial investment of $50,000, commissions of $10.00 per trade, and price slippage of 0.25% per transaction. That trimmed the overall return to 50.25 percent, a level that's still well above the average of the available Energy ETFs in the IndexUniverse.com Data tool, and even above the level of the best ETF in the sector: First Trust ISE NatGas (FCG).
Here is the current list of stocks produced by this Energy strategy, sorted by rank.
|
Caveat – suppose oil falls?
Figure 6 confines the test of the above screen to the period from July 1, 2006 to January 31, 2007, a span in which the Cushing Crude spot price fell from $73.94 to $58.17. (The actual peak-to-trough results were $77.05 on 8/7/06 to $50.51 on 1/18/07.)
Figure 6
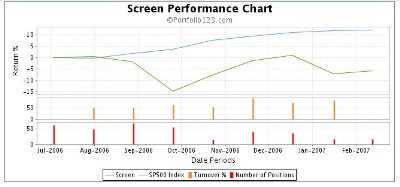
As you can see, that period wasn't pretty.
Is oil poised for a fall right now? If it happens, it probably won't be Wall Street's doing. Recent data from the Commodity Futures Trading Commission indicates that non-commercial players in the futures market have already been selling. They're still net long (12,712 contracts on 6/17/08), but not so much so as to justify saying there's a speculative bubble (in July 2007, there were over 100,000 long non-commercial positions). The recent buying momentum this year has been coming from commercial users. But we are hearing reports of demand destruction caused by high prices and a reduction in the willingness of some governments, such as China, to continue using subsidies to shield their economies from the impact of high prices.
But the bearish scenario is not inevitable. Much to the surprise of the I-told-you-it-was-a-bubble crowd, the late 2006 decline proved temporary. Looking ahead, supply may contract as prices fall, demand has already adapted to far higher prices than many of us would have dreamed possible only a short time ago. (How many of us envisioned oil even approaching $100 per barrel this time last year?)
Whatever your expectations for oil going forward, it is important to recognize that the estimate-revision approach presented here is not an all-seasons strategy. It's for bulls only.
