On the Analysis and Control of COVID-19 Epidemic Currently in US (Draft)
4/4/2020
Up to 4/4/2020, according to a well-recognized COVID-19 data website <www.point3acres.com>, US has an accumulated 312,000 diagnosed COVID-19 cases with a daily addition of 34,200 cases. How to effectively control its rapid growth is a currently pressing national issue。
- Assessment of Current Situation
Figure 1 depicts the outplay of the epidemic in US gauged with a parameter by the author known as the Daily Increase Ratio (DIR; Please refer to Appendix for its explanation). The outplay can be divided into four stages:
1). From 1/21/2020 when the 1st known case was discovered up to 3/9/2020, designated as Stage I (Natural Propagation Stage), the epidemic mainly developed at its natural infection rate (DIR about 1.33).
2). On 3/9/2020, on the National News Conference, the virus was downplayed as an equivalency of a flu, and the American Citizens were told that the infection is mainly to the elder population. This coupled with the low number of diagnosed cases at that time (750 cases), created a false complacency in the nation, especially among younger population. This view resulted in a much-increased DIR (1.5) till the announcement of the National Emergency and Practice of Social Distancing (SD) on 3/13/2020. This Stage is designated as the Stage II and termed as The Boosted Stage. During this stage, the DIR increased consistently day over day from 1.24 to 1.51 till 3/13/2020.
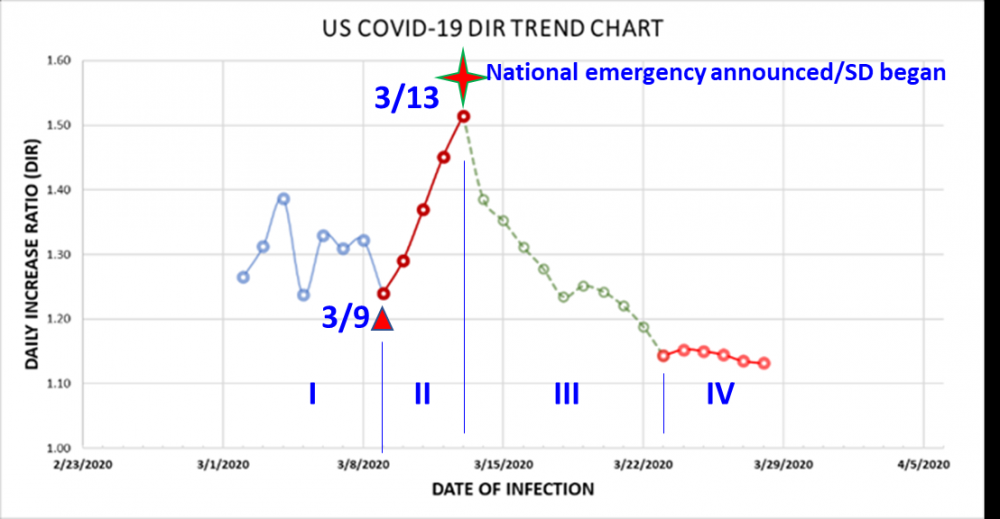
Fig. 1 Epidemic Development Stages in US (up to 4/4/2020)
3). On 3/13/2020, the President announced a National Emergency accompanied with a slew of SD measures. Responding to this policy and practices, the DIR consistently declined to about 1.15 till 3/23/2020 when the SD effect is matured as discussed immediately after. This Stage III is termed as the SD Stage.
4). On 3/23/2020, 10 days after the NE announcement, the data suggests that the DIR downward trend changed its course and became much flatter as suggested in the 5 consecutive data points till now at the time of this report writing. This Stage IV is termed as the Stagnation Stage.
It is noted that the benefit of the SD is substantial. During this period, the DIR reduced by about 0.35. If were no SD, the cases would have amassed to a much higher level at 823,000 cases up to the end of Stage III versus the actual level of 142,700, delivering a welcoming reduction of 680,000 diagnosed cases. Please note that the real benefit would be much larger since the actually infected population is much greater than the diagnosed one.
What is worrisome and concerning is the currently on-going Stage IV (designated as the Stagnation Stage) which suggests the DIR no longer continued its trend as shown in the SD Stage. The stagnation will cause much concerned larger accumulation since the huge base built up to date. At the time of creating this report (4/4/2020 afternoon), the accumulated case is already stacked up to 310,000 . If were the trend continued from Stage III into Stage IV, we would have had 200,000 cases today instead of 310,000 cases.
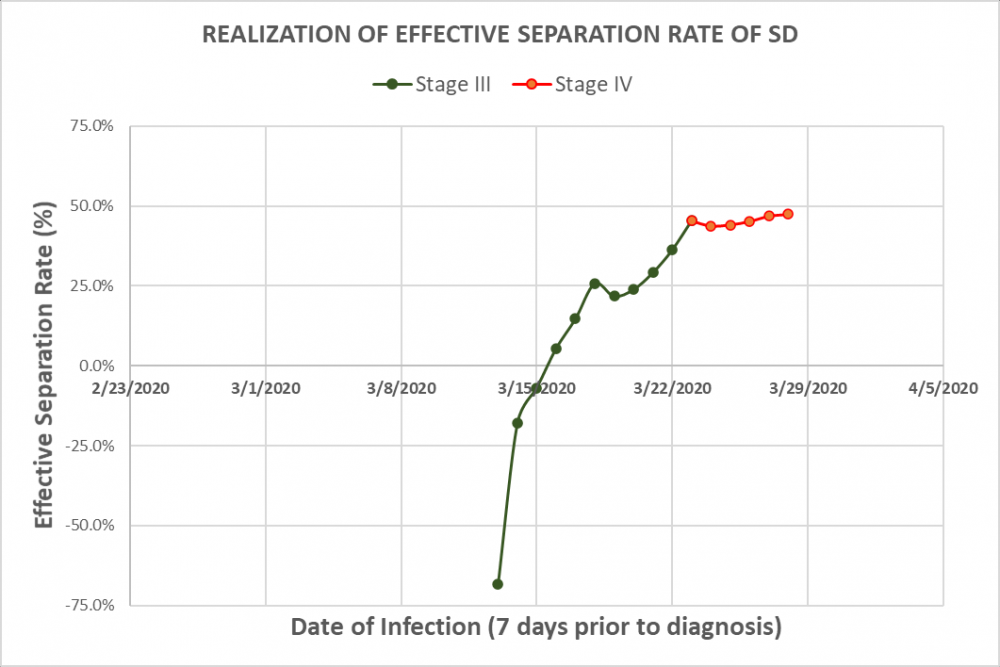
To understand the transition from Stage III to Stage IV, the Effective Separation Rate (ESR) is analyzed. ESR is defined as the number of eliminated transmission paths as a percentage of the number of the transmission paths at a reference state. The reference state is chosen as the one in Stage I (when people have a “normal” life). A negative rate means more crowded gatherings or clusters and a positive rate indicates the opposite. It is noted that Stage III traverses 10 days which is about 2 transmission spans (transmission span is the interval between the infected date of a carrier to the date of infecting others, generally 4 to 5 days statistically). Figure 2 shows that after SD practice started, the ESR started to increase day by day to realize its effect. After 10 days, or two transmission spans, the total effect became matured and reached its max at a level about 45% on 3/23/2020. In practice, SD significantly reduced the office gatherings, and the crowds found in the service sectors (such as Gyms, Pubs, Coffee Shops and such) but does not eliminate family clusters, small gatherings (presumably no more than 5), those found in the public transportation vehicles, shopping gatherings, and small groups of street pedestrians as well as found in recreational parks.
2. What Drives the Current Daily Increases?
Two necessary factors must be in place for an infection to occur: Infection Source and Transmission Path. Out of the 310,000 being diagnosed, a crude estimation suggests a 15 to 30 multiples would have been infected. Even though about 13% of the diagnosed ones are currently hospitalized, a huge amount of carriers are being mobile in the population. Even though through SD, there is a commendable 50% ESR has been created, there is still about 50% transmission pathways being open. Even with the currently reduced DIR of 1.12~ 1.15, when operated on this large base, the a prohibitively large amount of new infections will be generated on a daily basis. When this daily increased carriers added onto the already large base, the following day’s increase will be even larger (until the so called inflection point occurs). For example, on the DIR peak day, when the DIR was 1.51, the daily increase was 4849. While on 4/4/2020, the DIR was 1.12, the daily increase was 34405. A 7 times of daily increase due to the much larger base number. This shows that the current primary driving force of infection is the large base itself.
Although in every possible way, the separation strategy needs to be further enhanced, the emphasis now should be shifted to isolation in order to curb and eventually eliminate the epidemic. This is urgently needed since each day of delay means hundreds of thousands more being infected
Currently, the large base of carriers mainly drives the daily increases. The strategy should be shifted to the effective isolation of the carriers.
3. Suggested Measures to Curb the Current Situation
- Mobile Care Facilities (MCF)
Relative to the massive numbers needed to be isolated, it is suggested that the resources should be strategically allocated according to the severity per localities. For example, the severity can be categorized as National Level Epicenter(s); State Level Epicenter(s); and Town Level Epicenters(s)
Mobile Care Facilities (MCF) should be quickly set up to function as the temporary isolation shelters to provide tending cares for the persons who are infected and presumptively infected. The care centers should be able to provide preventive medical cares (medicines or alternative medicines to prevent from symptom worsening), resting and catering (symptom friendly diet), sanitary facilities (bathing and bathroom); group exercises, regulated schedule (to ensure good sleep and limited use of cell phones to boost immunity).
The Fed, coupled with the juristic State Government should focus their resources on the National Epicenters.
State, coupled with the juristic City Government should focus their resources on the State Level Epicenters.
The local town government is responsible for the local situation. School stadiums, YMCA’s, and local churches with readily available shower/bathroom facilities, and kitchens can be converted into MCFs. Currently at the town level, the number is generally on the level of a few hundred. This should be still a manageable quantity at today’s situation.
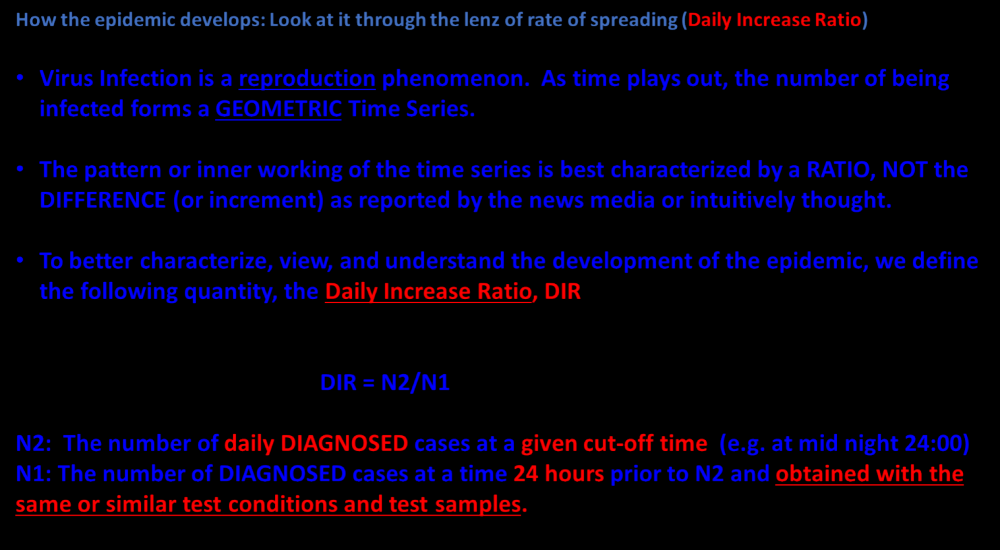
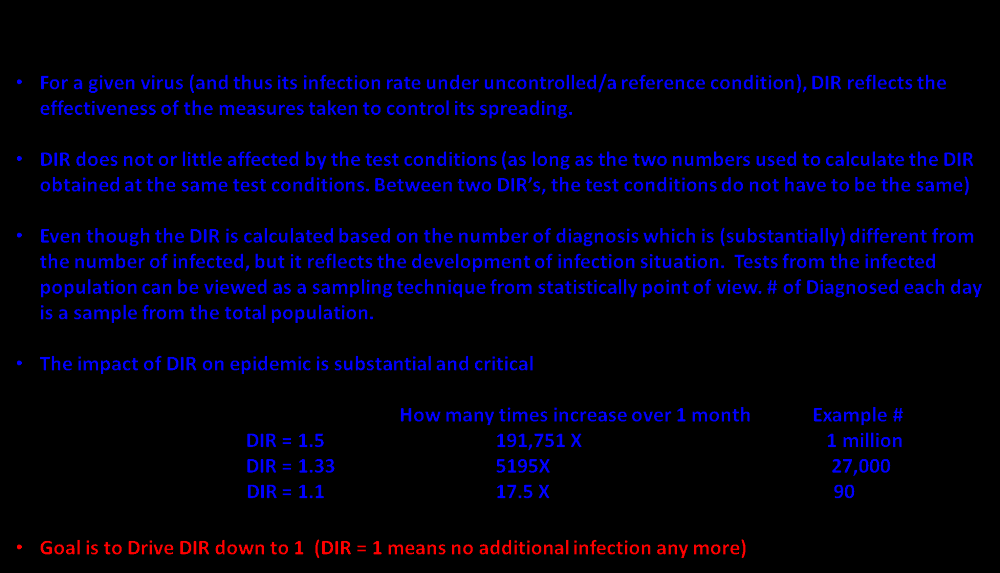
Appendix