NoXYZ
重磅新聞Stock Bombshell News
@stockbombshell on twitter


Top 10 Corporate Bond ETFs
 In an era of low interest rates, and perhaps distrust of equity markets, investing for income has become popular and a challenge. Another factor is demographics as baby boomers age they reduce risk-taking and increase the desire for income.
There are many ETF sectors to choose from where yield is a prime consideration along with quality. With fixed income and bonds the menu consists of the following: corporate, high yield, municipal, emerging market, government, international government, inflation-protected, mortgage-backed and preferred stock.
Many institutional investors (insurance companies and large pension plans) must have an allocation to bonds. Many asset allocation plans include bonds for individual investors. And, clearly savers and seniors especially gravitate to them for safety and income.
We'll be evaluating most of these issues and sectors beginning with corporate bonds. While we haven't included all that are available, we've sorted the top ten below by AUM (Assets under Management) but due to low prevailing interest rates also evaluate fees.
Corporate bond yields range from 2-4% overall. Investors should remember most corporate bond issues have call dates which would mandate early redemption at the option of the issuer. These can limit capital appreciation as existing issues are called-in at fixed prices and refinanced at lower interest rates.
Corporate bond supply is quite plentiful given low yields. This has made it compelling for companies to take advantage low cost funding for many purposes including stock buy-backs and rebuilding balance sheets.
Typically, most bond issues and sectors are not correlated to stocks. This was especially true during the previous bear market. However, recently given unusual Fed policies combining ZIRP (Zero Interest Rate Policies) with QE (Quantitative Easing) these non-correlations have become less apparent. This may prove temporary.
We feature a technical view of conditions from monthly chart views. Simplistically, we recommend longer-term investors stay on the right side of the 12 month simple moving average. When prices are above the moving average, stay long, and when below remain in cash or short. Some more interested in a fundamental approach may not care so much about technical issues preferring instead to buy when prices are perceived as low and sell for other reasons when high; but, this is not our approach.
ETF Digest members receive added signals when markets become extended such as DeMark triggers to exit overbought/oversold conditions.
For traders and investors wishing to hedge, leveraged and inverse issues are available to utilize from ProShares and Direxion and where available these are noted.
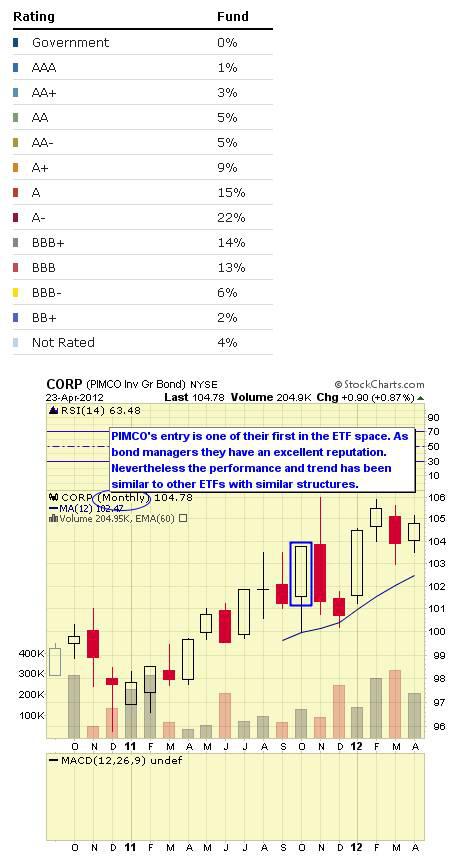
#10: PIMCO Investment Grade Corporate Bond ETF (CORP)
CORP tracks the Bank of America/Merrill Lynch U.S. Corporate Index with dollar denominated investment grade issues with maturities greater than one year. The fund was launched in September 2010. The expense ratio is 0.20%. AUM equal $233.5M with average daily trading volume of 13.2K shares.
One unique feature of CORP is that it rebalances its holdings monthly which might be a tax consideration for some investors. As of April 2012 the annual dividend yield was 2.54% and YTD return 4.11%. The one year return was 8.37%.
Data as of April 2012
Top 10 Holdings & Weightings
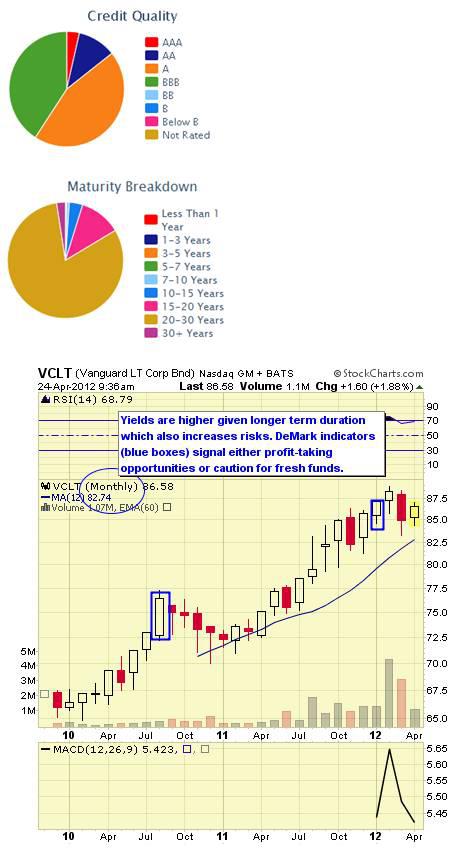
#9: Vanguard Long-Term Corporate Bond ETF (VCLT)
VCLT tracks the Barclays Capital U.S. Long Corporate Index which is investment grade, dollar denominated with maturities greater than 10 years. The fund was launched in November 2009. The expense ratio is 0.15%. AUM equal $770M and average daily trading volume is roughly 138K shares. As of April 2012 the annual dividend yield is 3.76% and YTD return 0.21%. The one year return is 15.59%. VCLT trades commission free at TD Ameritrade and Vanguard.
Data as of April 2012
VCLT Top Ten Holdings & Weightings
- General Elec Cap Corp Mtn Be 6.75%: 1.43%
- Pfizer 7.2%: 0.98%
- AT&T 8%: 0.96%
- Comcast Corp New 6.95%: 0.77%
- Wal Mart Stores 6.5%: 0.75%
- Goldman Sachs Grp 6.75%: 0.69%
- Oncor Elec Delivery 7%: 0.65%
- AT&T 6.8%: 0.64%
- Citigroup 6.875%: 0.63%
- CMT Market Liquidity Rate: 0.62%
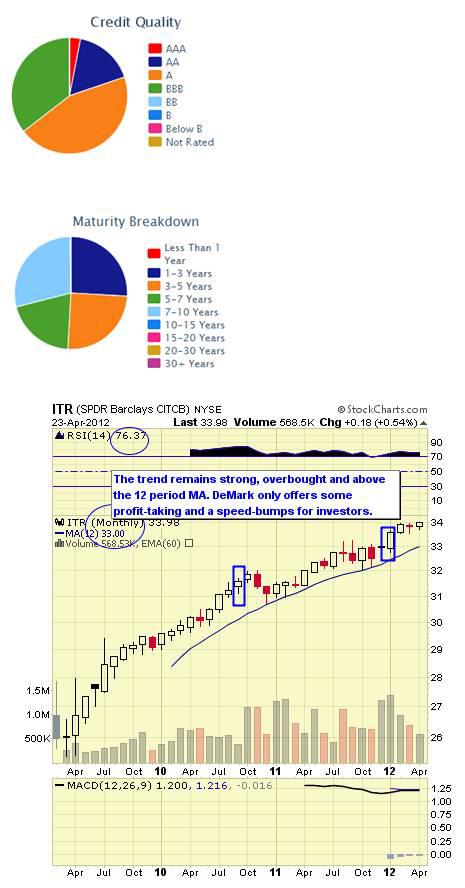
#8: SPDR Barclays Capital Intermediate-Term Bond ETF (ITR)
ITR tracks the Barclays Capital Intermediate U.S. Corporate Index. The index includes dollar denominated debt from U.S. and non-U.S. industrial utility and financial institutions with less than 10 year durations. The fund was launched in February 2009. The expense ratio is 0.15%.
AUM equals $260M and the average daily trading volume is 41K shares. As of April 2012 the annual dividend yield was 2.81% and YTD return 2.32%. The one year return was 5.87%.
Data as of April 2012
ITR Top Ten Holdings & Weightings
- Morgan Stanley 3.45%: 0.57%
- Goldman Sachs Grp 5.95%: 0.54%
- Amer Express 7.25%: 0.54%
- Goldman Sachs Grp Inc Mtn Be 3.7%: 0.50%
- Morgan Stanley 4.75%: 0.49%
- Merrill Lynch Co Inc Mtn Be 6.875%: 0.49%
- Bear Stearns Cos 7.25%: 0.49%
- Bellsouth 5.2%: 0.49%
- Amer Intl Grp Inc Mtn Be 5.85%: 0.48%
- Morgan Stanley 5.625%: 0.48%
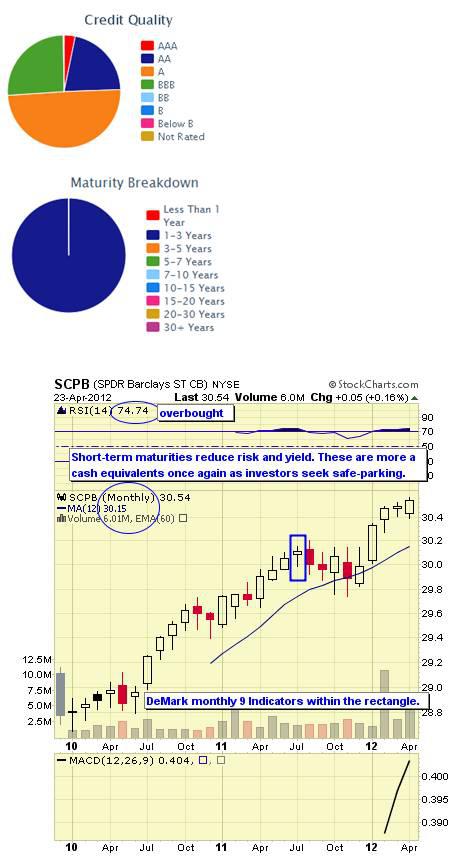
#7: SPDR Barclays Capital Short-Term Bond ETF (SCPB)
SCPB follows the Barclays Capital U.S. 1-3 Year Corporate Bond Index. The Barclays Capital U.S. 1-3 Year Corporate Bond Index is designed to measure the performance of the short term U.S. corporate bond market. The Index includes publicly issued U.S. dollar denominated corporate issues that have a remaining maturity of greater than or equal to 1 year and less than 3 years, are rated investment grade (must be Baa3/BBB- or higher.
The fund was launched in December 2009. The expense ratio is a low 0.12%. AUM equal $1M while average daily trading volume is 314K shares. As of April 2012 the annual dividend yield was 1.50% and YTD return 1.43%. The one year return was 1.77%.
Data as of April 2012
SCPB Top Ten Holdings & Weightings
- Bear Stearns & Co 5.7%: 0.92%
- Wells Fargo Co Mtn Be 3.75%: 0.88%
- Verizon Wireless Cap 5.55%: 0.80%
- Credit Suisse New York Branch 5.5%: 0.78%
- Bk Amer Fdg 7.375%: 0.76%
- Morgan Stanley 4.75%: 0.68%
- Citigroup 5%: 0.66%
- BNP Paribas / BP Paribas Us 3.25%: 0.61%
- General Elec Cap Corp Mtn Be 3.75%: 0.60%
- Citigroup 5.5%: 0.59%
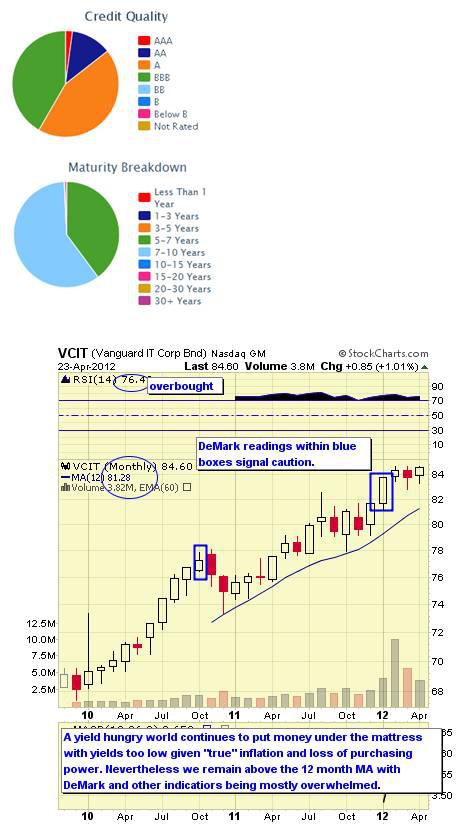
#6: Vanguard Intermediate Term-Corporate Bond ETF (VCIT)
VCIT tracks the Barclays Capital U.S. 5-10 Year Corporate Bond Index. The fund was launched in November 2009. The expense ratio is 0.15%. AUM equal $2M while average daily trading volume is 319K shares. As of April 2012 the annual yield was 3.16% and YTD return 3.02%. The one year return was 9.48%.
VCIT trades commission free at TD Ameritrade and Vanguard.
Data as of April 2012
VCIT Top Ten Holdings & Weightings
- CMT Market Liquidity Rate: 2.27%
- US Treasury Note 0.875%: 0.95%
- General Elec Cap Corp Mtn Be 6%: 0.86%
- AT&T 5.5%: 0.69%
- Morgan Stanley 5.5%: 0.68%
- Goldman Sachs Grp 6.15%: 0.56%
- Wells Fargo & Co New 5.625%: 0.54%
- Verizon Comms 5.5%: 0.51%
- JPMorgan Chase 6%: 0.48%
- Bk Amer Fdg 5.65%: 0.47%
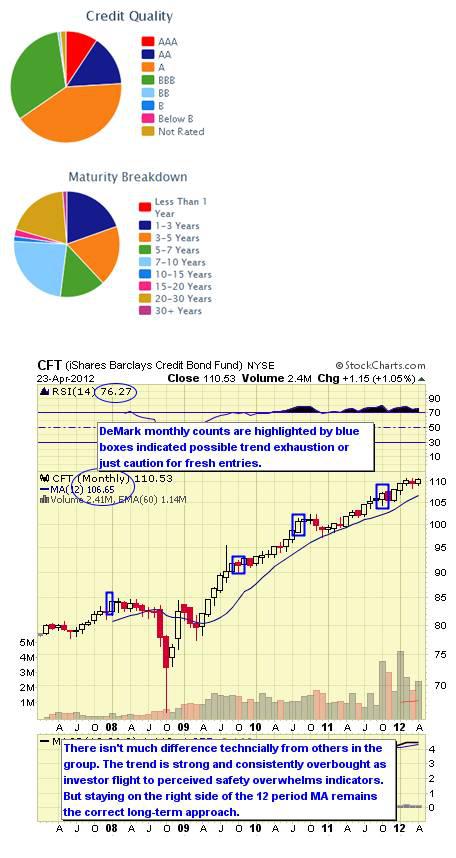
#5: iShares Barclays Credit Bond ETF (CFT)
CFT follows the Barclays Credit Bond Index which includes dollar denominated corporate and agency debt and have maturities greater than one year. In the top ten holdings you'll note a mix between dollardenominated overseas issues and even a municipal bond issue. The fund was launched in January 2007.The annual expense ratio is .20%. AUM equal $1.2M and average daily trading volume is roughly 132K shares. Nearly 75% of current maturities are within 10-years. As of April 2012 the annual yield is 3.02% and YTD return 1.44%. The one year return was 8.45%.
(NOTE: Recent sovereign downgrades in European debt will negatively affect credit quality going forward.)
Data as of April 2012
CFT Top Ten Holdings & Weightings
- JPMorgan Chase 3.45%: 0.36%
- Brazil Federative Rep 7.125%: 0.24%
- European Invt Bk 1.5%: 0.24%
- Bhp Billiton Fin Usa 6.5%: 0.24%
- Goldman Sachs Grp 5.25%: 0.23%
- European Invt Bk: 0.23%
- Brazil Federative Rep 4.875%: 0.23%
- Petrobras Intl Fin 5.375%: 0.23%
- Bp Cap Mkts 3.625%: 0.23%
- Bk Amer 5%: 0.22%
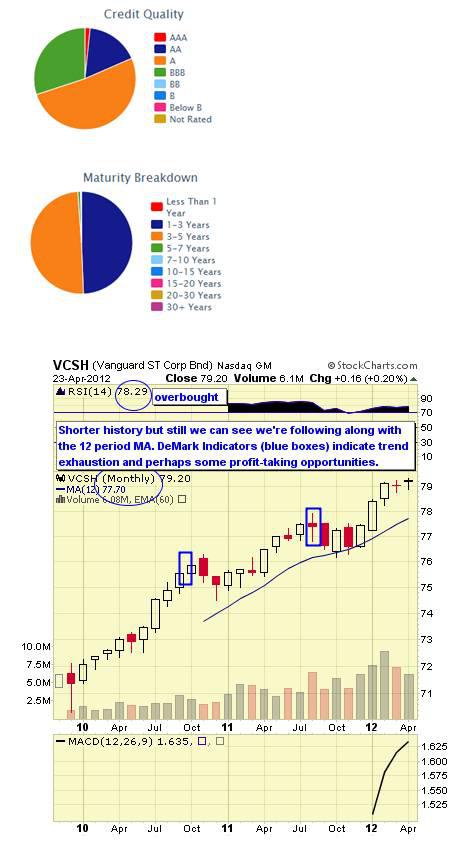
#4: Vanguard Short-term Corporate Bond ETF (VCSH)
VCSH also tracks the Barclays Capital U.S. 1-5 Year Corporate Index which includes U.S. dollar-denominated, investment-grade securities. Vanguard in general would like to compete with similar offerings based on lower fees. And, if you're an investor with a shorter term investment horizon and with interest rates this low, fees would matter. The fund was launched in November 2009.
The expense ratio is .15% versus .20% for other similar products with yields already low making some difference. AUM equal $2.9Mand average daily trading volume is 378K shares. As of April 2012 the annual dividend was 2.02% and YTD return 1.96%. The one year return was 3.64%. VCSH trades commission free at TD Ameritrade and Vanguard.
Data as of April 2012
VCSH Top Ten Holdings & Weightings
- US Treasury Note 0.875%: 0.80%
- General Elec Cap Corp Mtn Be 1.875%: 0.75%
- JP Morgan Chase 3.7%: 0.75%
- Citigroup 5.5%: 0.63%
- Goldman Sachs Grp Inc Mtn Be 3.7%: 0.61%
- General Elec Cap Corp Mtn Be 5.45%: 0.54%
- Bk Amer Fdg 4.9%: 0.53%
- Amer Express Cr Corp Mtnbe 5.875%: 0.50%
- Citigroup 4.75%: 0.47%
- Verizon Wireless Cap 5.55%: 0.47%
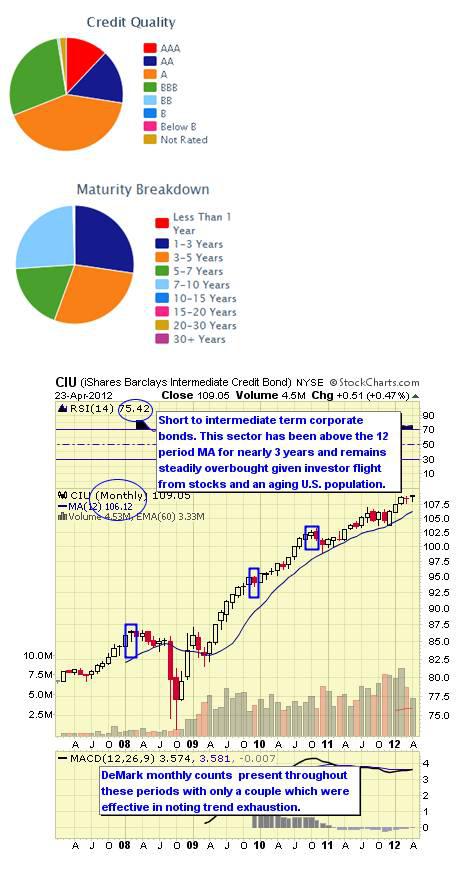
#3: iShares Barclays Intermediate Bond ETF (CIU)
CIU follows the Barclays Intermediate Credit Bond Fund Profile which consists of investment grade bonds with maturities of greater than one year but less than 10 years. The fund was launched in January 2007. The expense ratio is .20%. AUM equal $4.6M with average daily trading volume 326K shares. As of April 2012 the annual dividend yield was 2.73% and YTD return 1.80%.
The 1 year return was 5.70%. CIU trades commission free at TD Ameritrade.
Data as of April 2012
CIU Top Ten Holdings & Weightings
- European Invt Bk 1.5%: 0.41%
- European Invt Bk 1.25%: 0.40%
- European Invt Bk 4.625%: 0.40%
- Asian Dev Bk 2.5%: 0.33%
- Kreditanstalt Fur Wiederaufbau 1.375%: 0.31%
- Kreditanstalt Fur Wiederaufbau 4.375%: 0.30%
- Inter Amern Dev Bk Global Mtn 2.25%: 0.29%
- European Invt Bk: 0.28%
- Amer Express Cr Corp Mtnbe 2.75%: 0.27%
- Citigroup 5%: 0.27%
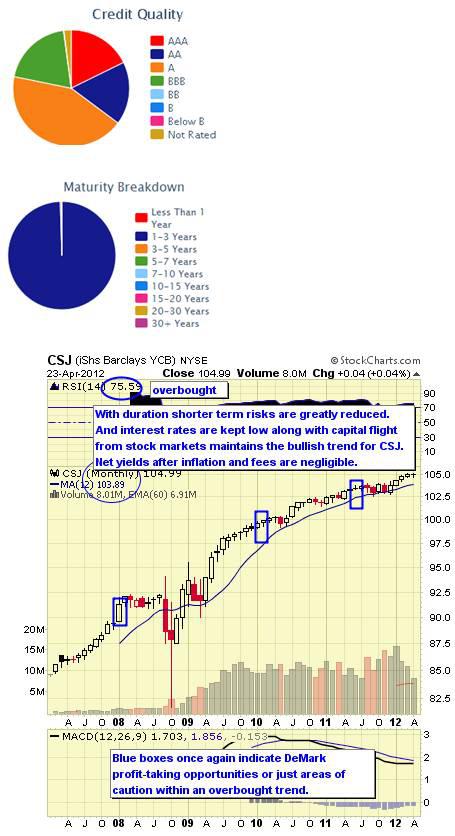
#2: iShares 1-3 Year Credit Bond ETF (CSJ)
CSJ tracks the Barclays Capital U.S. 1-3 year Credit Bond Index which includes corporate and sovereign debt and non-U.S. agency bonds. The bonds held are shorter-term in duration clearly virtually eliminating duration risk. Bonds within the holdings are all investment grade. The fund was launched in January 2007. The expense ratio is .20%. AUM is over $9.3M and trading volume averages over 551K shares daily.
As of April 2012 the annual dividend yield was 1.37% and YTD return 0.67%. The one year return was 1.64%.
(NOTE: With recent European sovereign downgrades this pie chart could change soon.)
Data as of April 2012
CSJ Top Ten Holdings & Weightings
- European Invt Bk 1.5%: 0.91%
- Intl Bk For Recon & 1.125%: 0.80%
- Citigroup 6.5%: 0.74%
- Kreditanstalt Fur Wiederaufbau 2.75%: 0.70%
- Kreditanstalt Fur Wiederaufbau 1.375%: 0.69%
- Intl Bk For Recon & 1.75%: 0.69%
- Asian Dev Bk 0.875%: 0.67%
- Ontario Prov Cda 4.1%: 0.65%
- European Invt Bk: 0.63%
- Kreditanstalt Fur Wiederaufbau 3.5%: 0.62%
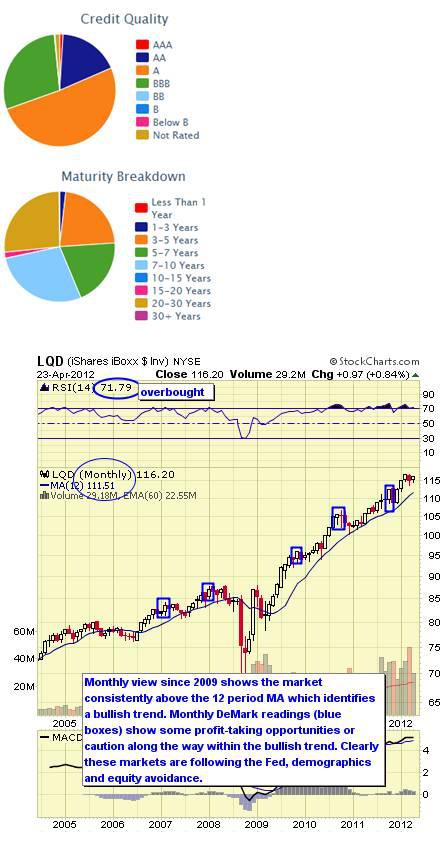
#1: iShares iBoxx Investment Grade Bond ETF (LQD)
LQD tracks the iBoxx Liquid Investment Grade Index comprising over 600 bond issues. The fund was launched in July 2002. The expense ratio is .15%. AUM (Assets under Management) equal $20M and daily trading volume averages 1.9M shares. Over 70% of constituent holdings have maturities between 3-10 years and 35% are within the financial sector. This would be considered moderate and offers less duration risk.
As of April 2012 the annual dividend yield was 3.21% with YTD 2.13%. One year return was 9.75%. LQD trades commission free at Fidelity and TD Ameritrade.
Data as of April 2012
LQD Top Ten Holdings & Weightings
- AT&T 5.5%: 0.59%
- Wells Fargo & Co New 5.625%: 0.59%
- Wal-Mart Stores 6.5%: 0.58%
- AT&T 6.55%: 0.57%
- Amer Intl Grp Inc Mtn Be 5.85%: 0.53%
- Credit Suisse New York Branch 5.3%: 0.52%
- General Elec Cap Corp Mtn Be 5.875%: 0.52%
- General Elec Cap Corp Mtn Be 5.625%: 0.51%
- Comcast Corp New 6.95%: 0.51%
- JP Morgan Chase 6.3%: 0.49%
We rank the top 10 ETF by our proprietary stars system as outlined below. If an ETF you're interested in is not included but you'd like to know a ranking send an inquiry to support@ETFDigest.com and we'll attempt to satisfy your interest.
Strong established linked index
Excellent consistent performance and index tracking
Low fee structure
Strong portfolio suitability
Excellent liquidity

Established linked index even if "enhanced"
Good performance or more volatile if "enhanced" index
Average to higher fee structure
Good portfolio suitability or more active management if "enhanced" index
Decent liquidity

Enhanced or seasoned index
Less consistent performance and more volatile
Fees higher than average
Portfolio suitability would need more active trading
Average to below average liquidity

Index is new
Issue is new and needs seasoning
Fees are high
Portfolio suitability also needs seasoning
Liquidity below average
As the Fed continues to maintain a low interest rate policy while stock markets have been uncertain and volatile investors have flocked to bonds. To this observers must also take into account changing demographics which reflect an aging U.S. population demanding less risk and more yield on their investments. At some point investors may realize that yields, particularly for longer term issues will not exceed inflation and purchasing power. Once these facts dawn on investors, they'll seek higher returns elsewhere. For now however, the trend is your friend.
It's also important to remember that ETF sponsors have their own competitive business interests when issuing products which may not necessarily align with your investment needs. New ETFs from highly regarded and substantial new providers are also being issued. These may include Charles Schwab's ETFs and Scottrade's Focus Shares which both are issuing new ETFs with low expense ratios and commission free trading at their respective firms. These may also become popular as they become seasoned.
