正文

Bear Markets And Recessions

(2019-07-27 20:14:29) 下一個

https://seekingalpha.com/article/4230288-bear-markets-recessions

Bear Markets And Recessions

|
11 comments
 
|
 Includes: BIBLBXUBBXUCCHGXCRFDDMDIADMRLDOGDUSADXDEDOWEEHEPSEQLEQWSESGLFEXFWDDGSEWHUSVIVVIWLIWMJHMLJKDOMFSOTPIXPMOMPPLCPSQQIDQLDQQEWQQQQQQEQQXTRSPRVRSRWMRYARXRYRSXSCAPSCHXSDOWSDSSFLASHSMLLSPDNSPLXSPSMSPUUSPXESPXLSPXNSPXSSPXTSPXUSPXVSPYSQQQSRTYSSOSYETNATQQQTWMTZAUDOWUDPIXUPROURTYUSAUSMCUSSDUSWDUWMVFINXVOOVTWOVVZF
 

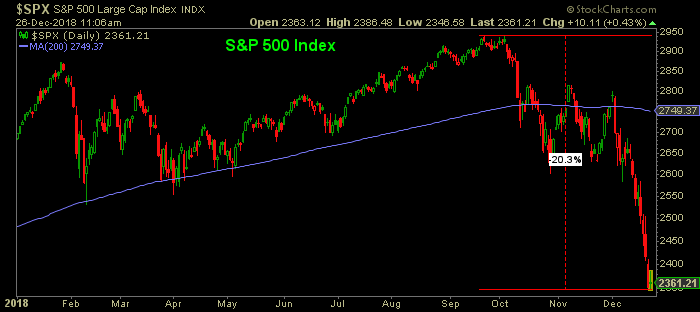
It's official: the bear market of 2018. Like many of the previous bears, it's been an elevator down, with a 20% decline in just 3 months.

The question many are asking: Is this decline just a decline or is it signaling an oncoming recession?

Looking back at history, the answer is far from clear. This is now the 21st bear market since 1929. Of the previous 20, only 11 were associated with a recession (55% of the time).

The list of bears with no recession is probably longer than you would have guessed...


What gives? Isn't the stock market a "leading indicator" of the economy? Yes, it can be at times, but it's far from a perfect one.

Sometimes a bear is just a bear. Is this one of those times? We'll only know in hindsight.

Looking at the data, the U.S. economy does not yet appear to be in a recession, but that fact is hardly an all-clear. After the March 2000 stock market peak, a recession did not begin until a year later: March 2001. No one can say for sure that in September 2019 (a year from the September 2018 S&P 500 peak) there won't be a recession.

And so, we wait, evaluating the evidence as it develops. If a recession is coming, the odds favor a longer and deeper bear market (-42% over 17 months on average). But there's much variation within those odds... In the 1990-91 recession, stocks declined only 20% over a 3-month period, and during the 1929-33 depression, stocks declined 86% during a 33-month period.


So while unlikely, a recession could be coming without any further stock market declines. It's safe to say that most investors are probably not thinking about a repeat of the 1990 scenario. They are most likely assuming the 50%+ recessionary bear markets of 2000-02 and 2007-09 are the norm. While a repeat of these calamities is certainly possible, so is a much shallower bear market and recession, or no recession at all.

In markets, every time is different. 2018 has proved this maxim once again.


The jury is still out .. on a monthly basis, the correction from the Sept monthly close has been -11.0% S&P500 total return .. Significant market declines since 1969, have occurred when a negative trend of the economy has been in agreement with the stock market trend ( Chapter 1 Part 1 , econometric and moving average variables * ) The economic trend is still positive. The evidence is still pointing to primary uptrend. 
. . . .
* tinyurl.com/y6w4ca8b ( paste link into browser address bar )
28 Dec 2018, 02:07 PMReply2Like
 
This was painful to read.


The S&P was formally introduced in 1957. All prior data by Schiller is contrived to fit the Dow Jones Industrial Average with questionable results, in spite of the existence of the DJIA since 1896.


Why do analysts work so hard to break down the data when there is a source that is continuous and unchanged in the period in question.


Some analysts might say something like, the S&P 500 is more representative of the ENTIRE U.S. economy. However, when you compare the Dow Jones Industrial Average to the S&P 500 from 1957, you will realize that the performance between the two indexes is so close that if presented with the year and the performance side-by-side, even the well trained analyst would not be able to identify which index is which.


Some might also argue that market capitalization is a better method for calculating an index instead of a price weighted index. Again, the performance of both is surprisingly similar considering that one contains 500 companies and the other has 94% fewer companies.


Sadly, the author manages to arbitrarily select a starting point of 1929. The NBER for recessions shows data from 1857 to the present. Why the cutoff at 1929?


The author could have selected data from the beginning of the Federal Reserve in 1914 to the present. At least that would have confirmed or refuted the "Fed put" arguments.


Alternatively, the author could have selected the period from 1957 to the present. That data would have coincided with the existence of the S&P 500.


Another popular random point could have been the post-war period. We cannot fathom why or how 1929 was the starting point.


The most egregious error in this piece, hands down, is coming away with the conclusion that "While a repeat of these calamities is certainly possible, so is a much shallower bear market and recession, or no recession at all." Not saying anything is far superior to saying, "I've got bad data and analysis, it's anybody's guess."


This article neither clarifies bear markets or recessions and the potential relationship between the two.
27 Dec 2018, 01:11 PMReply3Like
 
Guess why?


Because the goal was to show there is not always a direct relationship between bear markets and recessions. When you understand that you also understand why the author picked 1929 as a start.


Thankxs for the Dow reference. I will redo some homework.


drftr
27 Dec 2018, 06:08 PMReply0Like
 
@drftr


I have responded to your claim that "...there is not always a direct relationship between bear markets and recessions" with an article titled "The Dow and Recessions" which covers data from 1900 to the present. (found here: www.newlowobserver.com/...


I appreciate your criticisms once you have had time to review it.
29 Dec 2018, 12:25 AMReply1Like
 
Thanks for that article...


What I was referring to is the enormous lead/lag time between signalling a potential recession and a bear market. I think in one of his other articles Charlie showed that the lead time is often over a year! Not only that, but also that those last stages of the business cycle are (or at least have been) tremendously profitable. Since I'm in it for the money for me the gamble whether or not it's going to happen and when, leaves too much money on the table. Therefore I will most likely stay with "price" being the best indicator of what's happening, using a simple 200 day moving average as the cut off moment.


A minor detail is that the 63% coincidence level that you mention indeed is above the 50% "no relation level". But to say it's wildly off is something different.


All in all a very interesting read and recommended for readers of Charlie's stuff.


drftr
29 Dec 2018, 12:03 PMReply1Like
 
Bear Market is over, I hope you have been buying. New all time highs going ahead
27 Dec 2018, 12:28 AMReply0Like
 
All I know is you’re gonna hit some hard resistance getting back to previous 2018 lows, just before 2600 or 260 SPY... many people were way too long and want out... today was not very heavy volume... mostly a bunch of stops getting run Algo style as all stops had been run on the longs already, don’t count anything for granted. We are in no mans land
27 Dec 2018, 12:42 AMReply0Like
 
good info
26 Dec 2018, 10:07 PMReply0Like
 
So, the answer is a definitive "maybe."
26 Dec 2018, 08:07 PMReply2Like
 
@Civilization Type 1


lol
One day, even one like today, does not a market make. However, those that think the bear has started are jumping the gun.
26 Dec 2018, 08:37 PMReply0Like
 
It is received wisdom that the definition of a bear market is -20%, but it is also arbitrary. It is not a bear if the long-term primary trend-line is not breached. 2011 didn't do it and today it hasn't done it either...yet.
26 Dec 2018, 07:56 PM
[ 打印 ]
閱讀 ()評論 (0)
評論
目前還沒有任何評論
登錄後才可評論.