風蕭蕭_Frank
以文會友


為什麽以及如何需要改革資本主義
https://www.linkedin.com/pulse/why-how-capitalism-needs-reformed-parts-1-2-ray-dalio/?published=t
Ray Dalio 創始人、CIO 導師、Bridgewater 董事會成員 2019 年 4 月 5 日
概括
我很幸運,在一個中產階級家庭長大,父母很照顧我,能上好的公立學校,並進入一個為我提供平等機會的就業市場。 我從小就相信,擁有平等的機會獲得基本護理、良好的教育和就業是公平的,也是最有利於我們集體福祉的。 擁有這些東西並用它們來建設美好的生活就是實現美國夢的意義。
12歲時,有人可能會說我成為了一名資本家,因為那時我把自己做各種工作賺來的錢,比如送報紙、割草坪、當球童,在股市火爆的時候投入股市。 這讓我迷上了經濟投資遊戲,過去 50 年的大部分時間我都在玩這個遊戲。 為了在這場遊戲中取得成功,我需要對經濟和市場如何運作有實際的了解。 多年來我對大多數國家大多數經濟體係的接觸告訴我,賺錢、儲蓄並將其轉化為資本(即資本主義)的能力是人們提高人民生活水平的最有效的激勵因素和資源配置因素 。 多年來,我還看到資本主義的發展方式對大多數美國人來說效果不佳,因為它為富人帶來自我強化的螺旋式上升,為窮人帶來螺旋式下降。 這造成了不斷擴大的收入/財富/機會差距,對美國構成了生存威脅,因為這些差距帶來了破壞性的國內和國際衝突並削弱了美國的狀況。
我認為大多數資本家不知道如何很好地分配經濟蛋糕,大多數社會主義者也不知道如何很好地做大經濟蛋糕,但我們現在正處於一個關鍵時刻:a)不同意識形態傾向的人們將共同努力 巧妙地重新設計係統,使蛋糕既能被分割,又能很好地成長,否則b)我們將發生巨大的衝突和某種形式的革命,這將傷害大多數人並使蛋糕縮小。
我相信所有美好的事物走向極端都可能會自我毀滅,一切都必須進化或消亡。 對於資本主義來說現在也是如此。 在這份報告中,我闡述了為什麽我認為資本主義現在對大多數美國人不起作用,我診斷了為什麽它產生了這些不充分的結果,並就如何改革它提出了一些建議。 由於這個報告比較長,我分兩部分來介紹:第一部分概述問題,第二部分提出我的診斷和改革建議。
為什麽以及如何需要改革資本主義
在解釋為什麽我認為資本主義需要改革之前,我將解釋一下我來自哪裏,這塑造了我的觀點。 然後,我將展示一些指標,讓我清楚地知道資本主義所產生的結果與我認為的我們的目標不一致。 然後,我將給出我的診斷,解釋為什麽資本主義會產生這些不充分的結果,並通過提供一些關於如何對其進行改革以產生更好的結果的想法作為結論。
第1部分
我從哪裏來
我很幸運,成長在一個中產階級家庭,父母很關心我,在一所好的公立學校接受教育,並能夠進入一個為我提供平等機會的就業市場。 有人可能會說我實現了美國夢。 當時,我和我周圍的大多數人都相信,我們作為一個社會必須努力為每個人提供這些基本的東西(特別是平等的教育和平等的工作機會)。 這就是機會均等的概念,大多數人認為它既公平又富有成效。
我想我在 12 歲時就成為了一名資本家,因為那時我把做各種工作(比如送報紙、割草坪、當球童)賺來的錢投入到了 20 世紀 60 年代股市火爆的股票市場。 這讓我迷上了投資遊戲。 盡管我沒有足夠的錢支付學費,但我還是上了大學和研究生院,因為我可以從政府學生貸款計劃中借錢。 然後我進入了一個為我提供平等機會的就業市場,我就上路了。
因為我喜歡玩市場,所以我選擇成為一名全球宏觀投資者,這也是我大約 50 年的職業生涯。 這要求我對經濟和市場如何運作有實際的了解。 這些年來,我接觸過大多數國家的各種經濟體係,並逐漸理解為什麽賺錢、儲蓄並將其投入資本(即資本主義)的能力是人們和人們的有效激勵因素。 提高人民生活水平的資源配置者。 這是一個效果
它是人們的有效激勵者,因為它用金錢獎勵人們的生產活動,這些金錢可以用來獲得金錢可以買到的一切。 它是資源的有效配置者,因為創造利潤要求所創造的產出比創造它的資源更有價值。 富有成效會導致人們賺錢,從而導致他們獲得資本(這是他們在投資工具中的儲蓄),這既可以通過在以後需要時提供資金來保護儲蓄者,也可以為那些能夠將其與他們的想法結合起來的人提供資本資源 並將其轉化為提高我們生活水平的利潤和生產力。 這就是資本主義製度。
多年來,我看到了共產主義的來來去去,也看到了所有經濟運行良好的國家,包括“共產主義中國”,都因為這些原因而將資本主義作為其製度的一個組成部分。 共產主義“各盡所能、按需分配”的理念被證明是天真的,因為如果沒有得到相應的回報,人們就沒有動力去努力工作,繁榮就會受到影響。 資本主義將薪酬與生產力聯係起來,創造了高效的資本市場,促進儲蓄和購買力的可用性,從而提高人們的生產力,效果要好得多。
我還從機械的角度而不是意識形態的角度研究了國家成功和失敗的原因,因為我以實際方式處理經濟和市場的能力就是我的得分標準。 如果您想查看我的研究摘要,了解各國成功和失敗的因素,請點擊這裏(鏈接)。 簡而言之,不良的教育、不良的文化(阻礙人們有效地共同運作的文化)、落後的基礎設施和過多的債務會導致糟糕的經濟結果。 當以下條件多而不是少時,就會出現最好的結果:a) 教育和工作機會均等,b) 整個高中時期良好的家庭或類似家庭的教育,c) 大多數人認為在一個係統內的文明行為 公平,以及 d) 自由且監管良好的商品、服務、勞動力和資本市場,為大多數人提供激勵、儲蓄和融資機會。
當然,這些年來我一直在密切關注各國的這些事情,尤其是在美國。 我現在將展示我們的體係正在產生的結果,這些結果使我相信資本主義對大多數美國人來說效果不佳。
為什麽我相信資本主義對大多數美國人來說效果不佳
在本節中,我將向您展示大量描繪情況的統計數據和圖表。 也許有太多不適合您的口味。 如果你覺得你已經過了收益遞減的階段,我建議你要麽通過閱讀粗體句子來快速瀏覽其餘部分,要麽跳到下一節,這解釋了為什麽我認為不改革資本主義將是一個錯誤。 對美國的生存威脅。
首先,我想向您展示富人和窮人之間存在的差異。 由於這些差異隱藏在平均值中,我將經濟分為收入最高的 40% 和收入最低的 60%。[1] 這樣我們就可以看到底層 60%(即大多數)的生活是什麽樣的,並可以將他們與頂層 40% 的生活進行比較。 我的發現顯示在這項研究中。 雖然我建議您閱讀它,但我會很快給您提供一些統計數據來描述這裏的情況。
幾十年來,大多數人的實際收入幾乎沒有增長,甚至沒有增長。 如下左圖所示,自 1980 年以來,處於底層 60% 的黃金年齡工人的實際收入(即經通脹調整後)沒有增長。而當時頂層 10% 的人的收入翻了一番,並且 [i] 如右圖所示,長大後收入高於父母的兒童比例已從 1970 年的 90% 下降到如今的 50%。 這是針對全體人口的。 對於大多數 60% 以下的人來說,前景更糟。
[二]
[三]
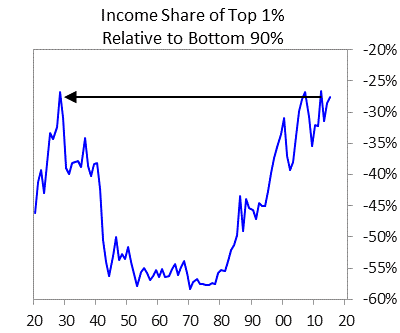
如下圖所示,收入差距與以往一樣高,貧富差距達到 20 世紀 30 年代末以來的最高水平。 如今,最富有的 1% 人口的財富超過了最底層 90% 人口的財富總和,這與 1935-40 年間(這一時期開啟了一個時代)存在的貧富差距是一樣的。 對於大多數國家來說,都存在巨大的內部和外部衝突)。 現在,收入最高 40% 的人擁有的財富平均是收入最低 60% 的人的 10 倍以上。[iv] 這一數字比 1980 年的六倍有所增加。
沒有為此圖像提供替代文本
[v]
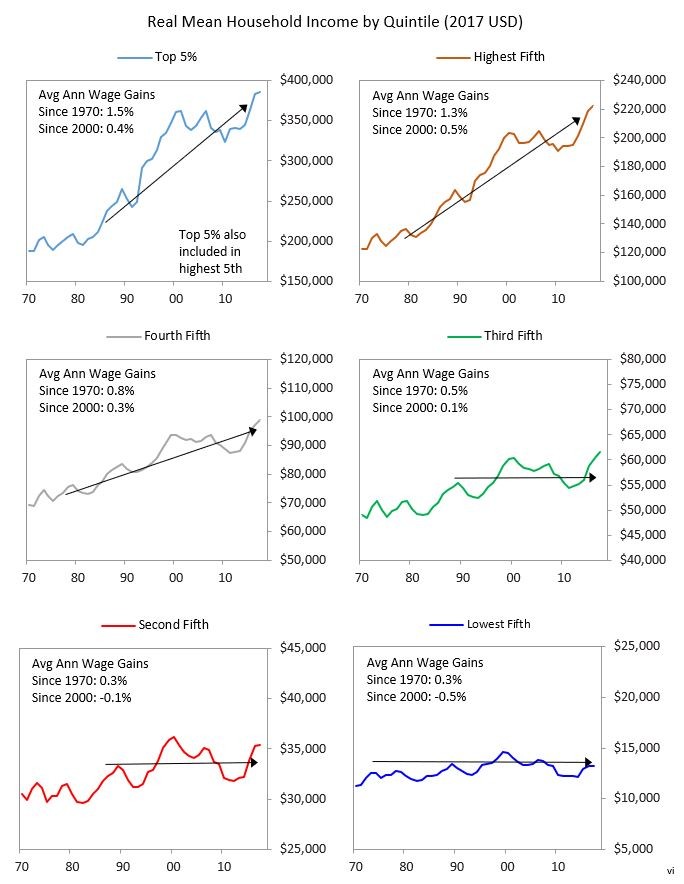
下麵的圖表顯示了自 1970 年以來總人口五分之一的實際收入增長情況。問問自己,你屬於哪一個。這可能已經給了你你的觀點。 我的目標是向您展示更廣闊的視角。
沒有為此圖像提供替代文本
大多數人在
底層 60% 是窮人。 例如,底層 60% 的人中隻有大約三分之一將其收入保存為現金或金融資產。[vii] 根據美聯儲最近的一項研究,40% 的美國人在緊急情況下很難籌集 400 美元 .[八]
他們越來越陷入貧困。 下圖顯示了在 10 年內處於底部五分之一的人晉升到中間五分之一或更高的幾率。 這些幾率從 1990 年的約 23% 下降到 2011 年的 14%。
[九]
雖然大多數美國人認為美國是一個經濟流動性和機會都很大的國家,但其經濟流動性目前是發達國家底層最差的國家之一。 如下圖所示,在美國,收入最低四分之一的人有 40% 的機會擁有收入最低四分之一的人(在父親收入最高的年份),而收入最高四分之一的人隻有約 8% 的機會擁有收入最低四分之一的人。 一位父親排在最後四分之一,表明晉升的平均概率隻有一半,也是所分析國家中概率最低的之一。 在一個機會均等的國家,這種情況是不存在的。
[X]
一個人的收入增長源於一個人的生產力增長,而生產力的增長又源於一個人的個人發展。 那麽讓我們看看我們如何培養人才。 讓我們從孩子開始吧。
對我來說,最無法忍受的情況是我們的係統無法照顧好這麽多的孩子。 正如我將要展示的那樣,他們中的許多人貧窮、營養不良(身體上和精神上)並且受教育程度低。 進一步來說:
美國的兒童貧困率目前為 17.5%,並且幾十年來一直沒有明顯改善。[xi]2017 年在美國,約 17% 的兒童生活在糧食不安全的家庭中,其中至少一名家庭成員無法獲得足夠的食物 [xii] 聯合國兒童基金會報告稱,美國生活在糧食不安全家庭的兒童比例低於平均水平(美國的情況比波蘭、希臘和智利更差)。[xiii] ]
這些情況的多米諾骨牌效應代價高昂。 收入低、學校資金不足、家庭對孩子的支持薄弱,導致學業成績不佳,進而導致人們生產力低下、收入低下,成為社會的經濟負擔。
盡管美國教育體係中有一些亮點,例如我們為數不多的幾所優秀大學,但在特定教育水平的標準化考試中,美國人口的整體得分相對於其他發達國家來說非常差。 進一步來說:
從最受尊敬的 PISA 測試成績來看,美國目前在發達國家中排名倒數第 15 個百分點。 如下所示,美國的得分幾乎低於意大利和希臘以外的所有發達國家。 這阻礙了許多人獲得足夠的生活水平和美國的競爭力。
[十四]
這些分數的差異與貧困程度有關,即高度貧困學校(以有資格獲得免費/減價午餐的學生比例來衡量)的 PISA 測試成績比貧困程度最低的學校低約 25%。
[十五]
在發達國家(即經合組織)國家中,美國的優勢學校和劣勢學校之間的師資短缺差異排名第三。
[十六]
統計數據顯示,與大多數其他國家相比,美國在滿足貧困學生的需求方麵做得很差。 這裏還有一些:
與經合組織國家的平均水平相比,美國接受過至少一年學前教育的弱勢學生比例較低。[xvii]
在經合組織國家中,截至 2008 年,美國的兒童貧困率在沒有工作的單親家庭中排名第二——這是社會安全網的失敗。[xviii]
這些糟糕的教育結果導致很大一部分學生對工作準備不足,並出現情緒問題,這些問題在破壞性行為中表現出來。 與大多數其他發達國家相比,美國的弱勢學生更有可能報告社交和/或情感問題,包括在學校無法融入社會、嚴重的考試焦慮和對生活的滿意度較低。
[十九]
34% 的高貧困學校經曆了學生長期缺課的情況,而高收入學校的這一比例僅為 10%。 [xx] 即使在人均收入最富裕的州之一康涅狄格州,也有 22% 的青少年缺課(即缺課)。 ,每年曠課超過 25 天,兩門或兩門以上課程不及格,或多次停學)或失聯(未入學且沒有高中學位的年輕人)。[xxi] 康涅狄格州失聯的青少年有 5 名 最終被監禁的可能性高出 33%,遭受藥物濫用的可能性高出 33%(完整報告鏈接在此)。
將康涅狄格州學區的高中畢業率與兒童貧困率進行比較,顯示出全州範圍內的緊密關係:
兒童貧困率提高 1% 相當於畢業率降低約 1%。
[二十二]
在各州,每個學生的支出與教育成果之間存在著密切的關係。
美國各州教育支出和成果的分散情況
[二十三]
美國最近的研究表明,獲得食品券的 5 歲以下兒童獲得了更好的健康和教育成果——高中畢業率估計提高了 18%——這使得他們依賴其他福利計劃的可能性大大降低 在以後的生活中。[xxiv]
來自貧困家庭並試圖上大學的學生準備不足。 例如,來自收入低於 20,000 美元家庭的學生在 SAT 考試中的平均成績比來自收入 200,000 美元以上家庭的學生差 260 分(滿分 1600 分),而且差距還在擴大。 根據 2011 年的一項研究,目前處於收入分配頂部和底部的兒童數量估計比 20 世紀 40 年代初高出 75%。 [xxvi]
然而,生活在較貧困社區的兒童平均每名學生獲得的州和地方資助比較富裕社區的兒童少約 1,000 美元。[xxvii] 盡管聯邦政府(根據其第一章資助公式)假設其成本 學區每年增加 40% 的資金來教育低收入學生達到與典型學生相同的標準。[xxviii] 因此,低收入地區的學校通常嚴重資金不足。 平均而言,公立學校 94% 的教師必須自掏腰包購買用品(通常包括基本清潔用品),而在最貧困的公立學校情況更糟。 [xxix]
一個相關的問題是,許多必須應對這些壓力條件的教師工資過低且不受尊重。 在我的成長過程中,醫生、律師和教師是最受尊敬的職業。 現在,教師的收入僅為其他大學畢業生收入的 68%,這比其他 OECD 發達國家的收入要低得多。 [xxx] 即使考慮周收入來調整學年長度並控製其他因素, 根據影響工資(如年齡和經驗年限),2017 年教師的收入比同等工作者低 19%,而 1994 年僅低 2%。[xxxi] 更糟糕的是,他們沒有得到應有的尊重。
收入/教育/財富/機會差距加劇了收入/教育/財富/機會差距:
富裕社區的公立學校往往比貧困社區資金充足得多,這加劇了收入/財富/機會差距。 造成這種資金缺口的主要原因之一是憲法將教育列為州問題,大多數州將地方學校主要由當地資助,因此富裕的城鎮擁有資金充足的公立學校,而貧困的城鎮則擁有資金不足的公立學校。 更具體地說,大約 45% 的學校經費來自地方政府,主要通過財產稅,而隻有大約 8% 來自聯邦政府,其餘來自州政府。 [xxxii] 因此,學校經費可能存在巨大差異。 各個社區的財富/收入。 此外,收入最高的 40% 的人在孩子的教育上的支出幾乎是收入最低的 60% 的人的五倍,而收入最高的 20% 的人在孩子的教育上的支出大約是收入最低的 20% 的人的六倍。 .[xxxiii]
資金不足的公立學校質量受到影響。 例如,PISA 數據顯示,師資嚴重短缺的美國學校的學生在測試中的成績比師資不短缺的學校的學生低 10.5%。 同樣,實驗室設備短缺與學生成績下降 16.7% 相關,圖書館資料短缺與學生成績下降 15.1% 相關。 [xxxiv]
相比之下,私立學校在學生身上的平均支出要高得多,而且成績也更好。 美國私立學校的每位學生支出比公立學校多約 70%,2016 年私立學校每位學生的平均支出約為 23,000 美元,而公立學校的平均支出約為 14,000 美元。[xxxv] 這種更高的支出意味著更高的考試 分數:在上一輪PISA測試中,美國私立學校學生在數學、閱讀和科學考試中的平均成績比公立學校學生高出4.3%。 自 2009 年以來的三項 PISA 調查中,私立學校學生的平均得分高出 6.9%。[xxxvi]
毫不奇怪,如今美國人對公立學校的信心比過去五年中的任何時候都要低得多。 如今,隻有 29% 的美國人對公共教育係統抱有“很大”或“相當大”的信任。 1975 年,62% 的美國人信任公立學校。[xxxvii]
對我來說,讓這麽多孩子陷入貧困而不給他們提供良好的教育就相當於虐待兒童,而且這在經濟上是愚蠢的。
家庭的弱化和父母的良好引導
也產生了重要的不利影響:
以下是一些統計數據,反映了家庭單位多年來的變化:
1960年,73%的兒童與兩個從未離婚的已婚父母生活在一起,13%的兒童生活在沒有兩個已婚父母的家庭中。 [2] 2014年,生活在沒有兩個已婚父母的家庭中的兒童比例為38%(現在隻有不到一半的兒童生活在有兩個父母第一次婚姻的家庭中)。 這些統計數據適用於美國所有家庭的平均水平。 低教育、低收入家庭的家庭支持要少得多。 大約 60% 的父母文化程度低於高中的孩子不生活在有兩個已婚父母的家庭中,而隻有 14% 的父母大學畢業的孩子生活在這樣的家庭中。 [xxxviii]
被監禁的概率與教育水平密切相關:在 28-33 歲的美國人中,35% 的高中輟學男性曾被監禁,而高中畢業生的男性比例約為 10%,大學畢業生的這一比例僅為 2%。 [xxxix]
1991 年至 2007 年間,有父母一方在州或聯邦監獄服刑的兒童數量增加了 80%。[xl] 如今,美國估計有 270 萬兒童有一方在監獄或看守所,即每 28 名兒童中就有 1 人 ( 占所有兒童的 3.6%)。[xli]
不良的兒童保育和不良教育會導致成年人行為不良,從而導致更高的犯罪率,給社會帶來可怕的代價:
美國的監禁率幾乎是其他發達國家平均水平的五倍,是新興國家平均水平的三倍。[xlii] 將人們監禁在監獄中的直接成本是驚人的,並且增長迅速:國家懲教成本在過去二十年裏翻了兩番 現在每年超過 500 億美元,消耗每 15 美元普通基金中就有 1 美元。[xliii]
這種糟糕的循環會持續下去,因為犯罪/逮捕記錄使找工作變得更加困難,從而降低了收入。 服役時間,即使是相對較短的時期,也會使男性的時薪減少約 11%,每年雇用時間減少 9 周,年收入減少 40%。[xliv]
低教育程度和貧困造成的健康後果和經濟成本是可怕的:
例如,對於收入最低 60% 的人來說,自 2000 年以來,過早死亡人數增加了約 20%。[xlv] 來自收入分配最低 20% 的男性的預期壽命比來自收入最高 20% 的男性少約 10 年。 [四十六]
美國幾乎是唯一一個過早死亡率持平/略有上升的主要工業化國家。 造成這一變化的最大因素是藥物/中毒死亡人數的增加(自 2000 年以來增加了一倍多)和自殺人數的增加(自 2000 年以來增加了 50% 以上)。 [xlvii]
自 1990 年以來,表示去年因費用原因而推遲接受嚴重疾病治療的美國人比例大約翻了一番,從 1991 年的 11% 增加到今天的 19%。[xlviii]
失業者或年收入低於 35,000 美元的人健康狀況較差,每組中有 20% 的人報告健康狀況不佳,大約是其他人群的三倍。[xlix]
據估計,僅美國兒童貧困的影響就會使醫療支出增加 GDP 的 1.2%。[L]
這些情況對美國構成了生存風險。
前麵描述的收入/財富/機會差距及其表現對美國構成了生存威脅,因為這些情況削弱了美國的經濟,有可能帶來痛苦和適得其反的國內衝突,並削弱美國相對於全球競爭對手的實力 。
這些差距削弱了我們的經濟實力,因為:
它們減緩了我們的經濟增長,因為富人的邊際消費傾向遠低於缺錢人的邊際消費傾向。
它們導致人才發展不理想,並導致大部分人從事破壞性活動而不是貢獻性活動。
除了社會和經濟方麵的不良後果外,收入/財富/機會差距還導致危險的社會和政治分歧,威脅到我們的凝聚力結構和資本主義本身。
我認為,作為一個原則,如果共享預算的人們的經濟條件存在很大差距,並且出現經濟衰退,那麽發生嚴重衝突的風險就很高。 財富的不平等,特別是當伴隨著價值觀的差異時,會導致衝突加劇,而在政府中,這會以左翼民粹主義和右翼民粹主義的形式表現出來,並且常常表現為某種類型的革命。 出於這個原因,我擔心下一次經濟衰退會是什麽樣子,特別是央行扭轉經濟衰退的能力有限,而且我們有如此多的政治極性和民粹主義。
問題在於,資本家通常不知道如何很好地分配蛋糕,而社會主義者通常不知道如何很好地做大蛋糕。 雖然人們可能希望當
在這種經濟兩極分化和惡劣條件存在的情況下,領導人會齊心協力改革體製,既要瓜分經濟蛋糕,又要讓它做得更好(這當然是可行的,也是最好的路徑),他們通常會變得越來越極端,鬥爭多於合作 。
為了理解民粹主義現象,兩年前我做了一個研究,看了14個標誌性案例,觀察了它們背後的模式和力量。 如果您對此感興趣,可以在這裏閱讀。 簡而言之,我了解到,當右翼或左翼的強大戰士/領導人尋求與反對派作戰並擊敗反對派時,民粹主義就會出現,他們上台並升級與反對派的衝突,這通常會激發相對強大/好鬥的領導人周圍的衝突。 民粹主義發展最重要的是如何處理衝突,對立勢力能否共存共進,還是越來越多地“開戰”,互相阻撓、互相傷害,造成僵局。 在最壞的情況下,這種衝突會導致經濟問題(例如,通過癱瘓的罷工和示威),甚至可能導致從民主領導轉向獨裁領導,正如 20 世紀 30 年代許多國家所發生的那樣。
我們現在看到世界各地左翼民粹主義者和右翼民粹主義者之間的衝突日益加劇,其方式與 20 世紀 30 年代的情況大致相同,當時收入和財富差距相當大。 在美國,意識形態的兩極分化比以往任何時候都更加嚴重,妥協的意願也比以往任何時候都少。 左圖顯示了自 1900 年以來共和黨參議員和代表的保守程度以及民主黨參議員和代表的自由程度。如您所見,他們都比以往任何時候都更加極端,分歧也更大。 右圖顯示了自 1790 年以來按黨派投票的比例,這是目前曆史上最高的一次。 換句話說,他們的極端立場更加極端,而且這些立場比以往任何時候都更加堅定。 我們即將進入總統選舉年。 我們可以期待一場地獄般的戰鬥。
沒有為此圖像提供替代文本
[李]
不需要天才就能知道,當一個體係產生的結果與其目標如此不一致時,它就需要改革。 在下一部分中,我將探討為什麽它會產生這些不合格的結果,以及我認為應該采取哪些措施來對其進行改革。
第2部分
我對為什麽資本主義現在不適用於大多數人的診斷
我相信現實就像一台機器,具有產生結果的因果關係,當結果達不到目標時,人們需要診斷機器工作不充分的原因,然後對其進行改革。 我還相信,大多數事情在曆史中一次又一次地發生,通過觀察和思考這些模式,人們可以更好地理解現實是如何運作的,並獲得永恒和普遍的原則來更好地處理它。 我認為前麵所呈現的結果是不可接受的,所以我們首先要看看經濟機器是如何產生這些結果的,然後再思考如何對其進行改革。
與左翼民粹主義者和右翼民粹主義者所說的相反,這些不可接受的結果並不是由於 a) 邪惡的富人對窮人做壞事,或者 b) 懶惰的窮人和官僚效率低下,盡管它們確實如此 由於資本主義製度現在的運作方式。
我相信,所有美好的事物走向極端都會變得自我毀滅,一切都必須進化或死亡,這些原則現在適用於資本主義。 雖然對利潤的追求通常是創造生產力和為那些有生產力的人提供購買力的有效動力和資源分配器,但它現在正在產生一個自我強化的反饋循環,擴大收入/財富/機會差距,以至於 資本主義和美國夢正處於危險之中。 這是因為資本主義現在的運作方式是,個人和公司發現製定政策和製造技術來降低人力成本是有利可圖的,從而減少了人口在社會資源中所占的很大比例。 那些更富有的公司和個人擁有更大的購買力,這會激勵那些尋求利潤的人將資源轉移到生產富人想要的東西(相對於窮人想要的東西),其中包括基本必需的東西,例如為富人提供良好的照顧和教育 -不是孩子。 我們剛剛在大學招生作弊醜聞中看到了這一點。
這種動態的結果是,該體係正在為富人產生自我強化的螺旋式上升,為窮人產生螺旋式下降,從而導致頂層有害的過度行為和底層有害的剝奪。 更具體地說,我相信:
追求利潤和集團
食客效率導致了取代人類的新技術的發明,這使得公司運營更加高效,獎勵了那些發明這些技術的人,並傷害了那些被這些技術取代的人。 這股力量在未來幾年將會加速,目前還沒有計劃能夠很好地應對。
對更大利潤和更高公司效率的追求也導致公司在其他國家生產,並用具有成本效益的外國工人取代美國工人,這對這些公司的利潤和效率有利,但對美國工人的收入不利。 當然,這種全球化也使得更便宜、或許質量更好的外國商品進入美國,這對外國賣家和美國買家來說都是好事,但對與之競爭的美國公司和工人來說則不利。
由於這兩種力量,用於利潤的收入份額相對於用於工人的份額有所增加。 下圖顯示了自 1929 年以來企業收入轉化為利潤的百分比以及轉化為員工薪酬的百分比。
沒有為此圖像提供替代文本
3. 央行印鈔和購買金融資產(這是應對2008年債務危機和刺激經濟增長所必需的)推高了金融資產的價格,這有助於使擁有金融資產的人相對於其他人變得更富有 誰不擁有它們。 當美聯儲(和大多數其他中央銀行)購買金融資產以將資金投入經濟以刺激經濟時,這些金融資產的賣家(他們足夠富有,擁有金融資產)a)變得更富有,因為金融資產 資產價格上漲,b)更有可能購買金融資產而不是購買商品和服務,這使得富人變得更富有,並擁有充足的貨幣和信貸,而大多數窮人則得不到貨幣和信貸,因為他們的收入較少 信譽良好。 從我從事投資行業的經曆來看,在大多數人都極度缺錢的同時,卻有大量的投資資金在追逐投資。 換句話說,錢被堵塞在頂層,因為如果你是那些有錢或有賺錢好主意的人之一,你可能會擁有比你需要的更多的錢,因為貸款人會自由地借給你,而投資者會競相借給你。 把它給你。 另一方麵,如果你的財務狀況不佳,沒有人會借錢給你或投資你,政府也不會提供實質性幫助,因為政府不這樣做。
4. 政策製定者過多關注相對於投資回報的預算。 例如,從預算角度來看,不花錢讓孩子教育好可能是件好事,但從投資角度來看,這確實是愚蠢的。 從預算角度看待資金並不會導致人們考慮到總體經濟狀況,例如,它沒有考慮到因教育程度低而給社會帶來的總體成本。 雖然財政保守派通常會關注預算,但財政自由派通常會借入太多資金,但無法明智地使用這些資金來產生償還其所承擔債務所需的經濟回報,因此他們經常以失敗告終。 應對債務危機。 預算鷹派保守派和支持支出/借貸的自由派很難集中精力、共同努力並實現良好的“雙底線”投資回報(即既產生良好社會回報又產生良好經濟回報的投資)。
我認為應該做的事
由於前麵解釋的原因,我認為資本主義是一個從根本上健全的製度,但現在對大多數人來說效果不佳,因此必須對其進行改革,以提供更多平等的機會並提高生產力。 為了進行更改,我認為需要進行以下操作。
來自高層的領導。 我有一個原則,你不會影響改變,除非你影響那些掌握權力杠杆的人,讓他們按照你希望他們改變的方式改變事情。 因此,國家高層需要強大的力量,宣布收入/財富/機會差距為國家緊急狀態,並承擔起重新設計係統的責任,使其更好地運作。
兩黨和熟練的政策製定者共同努力重新設計該係統,使其運作得更好。 我相信我們將以兩黨合作且熟練的方式做到這一點,否則我們會互相傷害。 因此,我認為領導層應該成立一個兩黨委員會,將來自不同社區的技術人員聚集在一起,製定一項計劃,重新設計係統,以同時更好地劃分和擴大經濟蛋糕。 該計劃將展示如何籌集資金並妥善使用/投資以生產良好的產品
雙底線回報
清晰的指標可用於判斷成功並讓負責人對實現目標負責。 在運行我運行的事物時,我喜歡有明確的指標來顯示那些負責事物的人正在做什麽,並根據這些指標的變化給予獎勵和懲罰。 擁有這些將產生實現成功所需的問責製和反饋循環。 在可能的情況下,我會將這種責任落實到個人層麵,以鼓勵一種責任文化,在這種文化中,個人意識到自己是社會的淨貢獻者還是淨損害者,並且個人和社會努力 讓他們成為淨貢獻者。
資源的重新分配將改善絕大多數人的福祉和生產力。 作為一名經濟工程師,我自然會考慮如何從稅收、借貸、企業和慈善事業中獲得資金,以及資金如何流動以影響價格和經濟。 例如,我考慮個人稅率的變化可能如何發生,個人稅率相對於公司稅率的變化將如何影響資金的流動方式,以及一個地點相對於另一地點的稅率變化將如何推動資金流動和結果 在他們中。 我還思考了很多關於籌集到的資金將如何使用的問題,例如,有多少資金將用於改善社會和經濟成果的項目,以及有多少資金將用於再分配。 當然,此類決定將由兩黨委員會的人員和領導層來決定,而且對於我來說,這是一項過於複雜的工程工作,無法在這裏發表意見。 不過,我可以給出我的總體傾向。 最重要的是,我希望取得良好的雙底線結果。 為此,我會:
A。 建立公私合作夥伴關係(包括政府、慈善家和公司),共同審查和投資雙底線項目,並根據相對於明確指標的社會和經濟績效結果來判斷這些項目。 這既會增加項目的資金,也會提高項目的質量,因為那些必須自己掏錢的人將對項目負責。 (示例請參見附錄。)
b. 通過考慮社會的總體成本,以改善條件和提高經濟生產力的方式籌集資金(例如,我將對汙染和造成健康狀況不佳的各種原因征稅,這些因素會給社會帶來相當大的經濟成本)。
C。 通過稅收從上層籌集更多資金,這些稅收將被設計為不會對生產率產生破壞性影響,並且將專門用於幫助中層和底層人民,主要以提高經濟整體生產率水平的方式,以便用於 這些方案的費用主要來自於它們所節省的成本和增加的收入。 話雖如此,我也認為社會必須建立最低標準的醫療保健和教育,為那些無法照顧自己的人提供服務。
5.貨幣政策和財政政策的協調。 由於資金被堵塞在頂層,而且央行放鬆貨幣政策以扭轉下一次經濟衰退的能力有限,財政政策必須與貨幣政策更加協調,而這可以在保持美聯儲獨立性的同時實現。 如果做得好,這既可以刺激經濟增長,又可以通過將貨幣和信貸從儲蓄和消費傾向較高的人轉移到消費傾向較高的人手中,減少量化寬鬆對貧富差距擴大的影響。 從那些需要較少的人到那些需要更多的人。
展望未來
在評估我們所處的位置時,我們可以考慮因果關係和曆史比較。 導致我們所看到的影響的最相關原因是:
導致 2008 年債務危機的高債務水平(此後不斷增加)導致……
央行大量印鈔並購買金融資產,推高資產價格並壓低利率。 這使那些擁有金融資產的人(即富人)受益,並使央行刺激經濟的權力減弱。
這些因素和新技術造成了非常大的收入/財富/機會和價值觀差距,預計這些差距將會擴大並導致……
左翼民粹主義和右翼民粹主義的加劇,同時引發了更大的國內和國際衝突……
一個崛起的大國(中國)將與現有的世界霸主(美國)競爭,這將導致經濟、意識形態和軍事方麵的競爭,並將由兩個大國的相對技能和技術能力決定 。 這場競賽將確定新的世界秩序將會是什麽樣子
剩下的世界
上一次出現這種影響格局是在20世紀30年代末,當時發生了巨大的衝突,經濟和政治製度被推翻。 出於前麵解釋的根本原因,我認為我們正處於這樣一個關鍵時刻,其中最大的問題將是我們如何處理彼此,而不是任何其他限製。
有足夠的資源來處理風險問題,並創造更多平等的機會,並提高生產力,從而擴大蛋糕。 我最擔心的是,雙方在立場上都會頑固不化,這樣資本主義要麽a)被放棄,要麽b)不被改革,因為右翼會爭取保持現狀,而左翼會反對它 。 因此,對我來說,最大的問題是:a)右翼民粹主義者或左翼民粹主義者是否會獲得控製權和/或發生會對政府運作、經濟和國際關係產生不利影響的衝突,或者 b)是否明智和熟練 各方人士可以共同努力,改革這個製度,讓這個製度為大多數人服務。
我們很快就會更多地了解哪些路徑最有可能,因為未來兩年美國、英國、意大利、西班牙、法國、德國和歐洲議會都將舉行決定性的選舉。 結果如何將對如何處理本報告中提出的衝突產生重大影響,這將影響資金在人民、市場、國家和國家之間的流動方式,並將決定大多數人民和國家的相對優勢。 我將密切關注這一切,並隨時向您通報情況。
附錄:我對雙重底線投資的看法
我覺得我應該舉一些良好的雙底線投資的例子,這就是本附錄的內容。 在我的慈善工作中,我一直看到巨大的雙底線投資,但我隻看到其中的一小部分,所以我知道還有更多。 由於我和我的妻子特別關注教育和小額信貸,因此我在這些領域的關注度比其他領域更多,盡管我們在醫療保健、刑事司法係統改革、環境保護等其他領域也接觸過很多領域。例如 ,我遇到的一些好的雙底線投資是:
當考慮到學生和社會的終生利益時,幼兒教育項目以政府節省成本的形式產生約 10-15% 的年回報率。 這是因為它們可以帶來更好的學習成績、更高的收入和更低的犯罪幾率,所有這些都為社會帶來直接的經濟效益。[liii]
相對便宜的幹預措施可以降低 8 年級和 9 年級高中輟學率,其成本可以達到數倍。 如果做得好,讓這些年輕學生接受實用的高等教育或從事貿易工作是非常劃算的。 例如,大學畢業生的終生收入比高中輟學者高出 100 萬美元以上。[liv]
學校財務改革表明,每名學生的支出增加 10% 可以對低收入學生的教育成果產生有意義的影響,比高收入學生的支出產生更高的投資回報率。 總體而言,研究人員發現額外的學校支出的 IRR 約為 10%。[lv]
小額信貸。 每捐贈/投資 1 美元,大約有 12 美元會被借出、償還,並在未來 10 年內再次借給弱勢群體來創辦和建立自己的企業。[lvi]
許多基礎設施支出計劃可以促進貿易並提高生產力/效率。 根據 33 項基礎設施投資投資回報率研究,估計智能基礎設施項目在增加經濟活動方麵的回報率為 10-20%,這使得政府借錢投資基礎設施成為一項不錯的交易 .[lvii]
公共衛生/預防性醫療幹預措施也可以產生非常積極的投資回報率。 根據 52 項研究預防性健康計劃投資回報率的研究(涵蓋各種計劃類型,包括疫苗、家庭血壓監測、戒煙等),這些計劃平均每 1 美元的成本創造 14 美元的收益。 第五十三]
由於這些領域對國家來說是巨大的雙底線投資,如果在政府的支持下擴大這些領域的規模,那就太好了。 我相信慈善機構、政府和企業之間針對此類投資的合作關係是強大的,因為它們既可以增加資金數額,又可以更好地審查項目和計劃。 我知道我看到了很多好的交易,我希望最大限度地提供資金,這對於政府、其他慈善家和企業來說支持成本效益高。 例如,我的妻子和我們的慈善團隊目前正在製定一項協議,如果康涅狄格州捐贈 1 億美元,並且康涅狄格州的其他慈善家和企業也捐贈 1 億美元,達利奧慈善基金會將向康涅狄格州資金最不足的學區和小額信貸項目捐贈 1 億美元 。 這將為我們的康涅狄格州社區帶來更多的資金、更好的盡職調查、更多的合作夥伴關係,以及積極的預期淨財務回報(考慮到沒有很好地教育和支持我們的孩子的成本之後),從而造福於該州。
Why and How Capitalism Needs to Be Reformed
https://www.linkedin.com/pulse/why-how-capitalism-needs-reformed-parts-1-2-ray-dalio/?published=t

I was fortunate enough to be raised in a middle-class family by parents who took good care of me, to go to good public schools, and to come into a job market that offered me equal opportunity. I was raised with the belief that having equal opportunity to have basic care, good education, and employment is what is fair and best for our collective well-being. To have these things and use them to build a great life is what was meant by living the American Dream.
At age 12 one might say that I became a capitalist because that’s when I took the money I earned doing various jobs, like delivering newspapers, mowing lawns, and caddying and put it in the stock market when the stock market was hot. That got me hooked on the economic investing game which I’ve played for most of the last 50 years. To succeed at this game I needed to gain a practical understanding of how economies and markets work. My exposure to most economic systems in most countries over many years taught me that the ability to make money, save it, and put it into capital (i.e., capitalism) is the most effective motivator of people and allocator of resources to raise people’s living standards. Over these many years I have also seen capitalism evolve in a way that it is not working well for the majority of Americans because it’s producing self-reinforcing spirals up for the haves and down for the have-nots. This is creating widening income/wealth/opportunity gaps that pose existential threats to the United States because these gaps are bringing about damaging domestic and international conflicts and weakening America’s condition.
I think that most capitalists don’t know how to divide the economic pie well and most socialists don’t know how to grow it well, yet we are now at a juncture in which either a) people of different ideological inclinations will work together to skillfully re-engineer the system so that the pie is both divided and grown well or b) we will have great conflict and some form of revolution that will hurt most everyone and will shrink the pie.
I believe that all good things taken to an extreme can be self-destructive and that everything must evolve or die. This is now true for capitalism. In this report I show why I believe that capitalism is now not working for the majority of Americans, I diagnose why it is producing these inadequate results, and I offer some suggestions for what can be done to reform it. Because this report is rather long, I will present it in two parts: part one outlining the problem and part two offering my diagnosis of it and some suggestions for reform.
Why and How Capitalism Needs to Be Reformed
Before I explain why I believe that capitalism needs to be reformed, I will explain where I’m coming from, which has shaped my perspective. I will then show the indicators that make it clear to me that the outcomes capitalism is producing are inconsistent with what I believe our goals are. Then I will give my diagnosis of why capitalism is producing these inadequate outcomes and conclude by offering some thoughts about how it can be reformed to produce better outcomes.
Part 1
Where I’m Coming From
I was lucky enough to grow up in a middle-class family raised by parents who cared for me, to be educated in a good public school, and to be able to go into a job market that offered me equal opportunity. One might say that I lived the American Dream. At the time, I and most everyone around me believed that we as a society had to strive to provide these basic things (especially equal education and equal job opportunity) to everyone. That was the concept of equal opportunity, which most people believed to be both fair and productive.
I suppose I became a capitalist at age 12 because that’s when I took the money I earned from doing various jobs like delivering newspapers, mowing lawns, and caddying, and put it in the stock market when the stock market was hot in the 1960s. That got me hooked on the investing game. I went to college and graduate school even though I didn’t have enough money to pay the tuitions because I could borrow the money from a government student loan program. Then I entered a job market that provided me equal opportunity, and I was on my way.
Because I loved playing the markets I chose to be a global macro investor, which is what I’ve been for about 50 years. That required me to gain a practical understanding of how economies and markets work. Over those years, I’ve had exposure to all sorts of economic systems in most countries and have come to understand why the ability to make money, save it, and put it into capital (i.e., capitalism) is an effective motivator of people and allocator of resources that raises people’s living standards. It is an effective motivator of people because it rewards people for their productive activities with money that can be used to get all that money can buy. And it is an effective allocator of resources because the creation of profit requires that the output created is more valuable than the resources that go into creating it. Being productive leads people to make money, which leads them to acquire capital (which is their savings in investment vehicles), which both protects the saver by providing money when it is later needed and provides capital resources to those who can combine them with their ideas and convert them into the profits and productivities that raise our living standards. That is the capitalist system.
Over those many years, I have seen communism come and go and have seen that all countries that made their economies work well, including “communist China,” have made capitalism an integral part of their systems for these reasons. Communism’s philosophy of “from each according to his ability, to each according to his needs” turned out to be naïve because people were not motivated to work hard if they didn’t get commensurately rewarded, so prosperity suffered. Capitalism, which connects pay to productivity and creates efficient capital markets that facilitate savings and the availability of buying power to fuel people’s productivity, worked much better.
I’ve also studied what makes countries succeed and fail by taking a mechanistic perspective rather than an ideological one because my ability to deal with economies and markets in a practical way is what I have been scored on. If you’d like to see a summary of my research that shows what makes countries succeed and fail, it’s here (link). In a nutshell, poor education, a poor culture (one that impedes people from operating effectively together), poor infrastructure, and too much debt cause bad economic results. The best results come when there is more rather than less of: a) equal opportunity in education and in work, b) good family or family-like upbringing through the high school years, c) civilized behavior within a system that most people believe is fair, and d) free and well-regulated markets for goods, services, labor, and capital that provide incentives, savings, and financing opportunities to most people.
Naturally, I have watched these things closely over the years in all countries, especially in the US. I will now show the results that our system is producing that have led me to believe capitalism isn’t working well for most Americans.
Why I Believe That Capitalism Is Not Working Well for Most Americans
In this section, I will show you a large batch of stats and charts that paint the picture. Perhaps there are too many for your taste. If you feel that you’re getting past the point of diminishing returns, I suggest that you either quickly scan the rest by just reading the sentences in bold or skip ahead to the next section which explains why I think that not reforming capitalism would be an existential threat to the US.
To begin, I’d like to show you the differences that exist between the haves and the have-nots. Because these differences are hidden in the averages, I broke the economy into the top 40% and the bottom 60% of income earners.[1] That way we could see what the lives of the bottom 60% (i.e., the majority) look like and could compare them with those of the top 40%. What I found is shown in this study. While I suggest that you read it, I will quickly give you a bunch of stats that paint the picture here.
There has been little or no real income growth for most people for decades. As shown in the chart below on the left, prime-age workers in the bottom 60% have had no real (i.e., inflation-adjusted) income growth since 1980. That was at a time when incomes for the top 10% have doubled and those of the top 1% have tripled.[i] As shown in the chart to the right, the percentage of children who grow up to earn more than their parents has fallen from 90% in 1970 to 50% today. That’s for the population as a whole. For most of those in the lower 60%, the prospects are worse.
![[ii]](https://media.licdn.com/dms/image/C4D12AQEyA5mRGGGnqQ/article-inline_image-shrink_400_744/0/1554468748233?e=1718841600&v=beta&t=bC3kQ4KpDaRPtM3-X-dooeNNETmRBPhrGiw3w2xoS_k)
![[iii]](https://media.licdn.com/dms/image/C4D12AQEh-Al3WTCo9Q/article-inline_image-shrink_400_744/0/1554468755547?e=1718841600&v=beta&t=VOkoIUtlDMuslDC3j45QYD12UAjp_RoQMaHhZ-RLSQw)
As shown below, the income gap is about as high as ever and the wealth gap is the highest since the late 1930s. Today, the wealth of the top 1% of the population is more than that of the bottom 90% of the population combined, which is the same sort of wealth gap that existed during the 1935-40 period (a period that brought in an era of great internal and external conflicts for most countries). Those in the top 40% now have on average more than 10 times as much wealth as those in the bottom 60%.[iv] That is up from six times in 1980.
![[v]](https://media.licdn.com/dms/image/C4D12AQEhWv8wXxgx9Q/article-inline_image-shrink_400_744/0/1554468868932?e=1718841600&v=beta&t=zOApJokG_5-v4dkPH1QyRFfnfHQGWc0rJJKglxwmH8A)
The following charts show real income growth by quintiles for the overall population since 1970. Ask yourself which one you’re in. That probably has given you your perspective. My objective is to show you the broader perspective.
Most people in the bottom 60% are poor. For example, only about a third of the bottom 60% save any of their income in cash or financial assets.[vii] According to a recent Federal Reserve study, 40% of all Americans would struggle to raise $400 in the event of an emergency.[viii]
And they are increasingly getting stuck being poor. The following chart shows the odds of someone in the bottom quintile moving up to the middle quintile or higher in a 10-year period. Those odds declined from about 23% in 1990 to only 14% as of 2011.
![[ix]](https://media.licdn.com/dms/image/C4D12AQG2fZ_mZQfeUA/article-inline_image-shrink_400_744/0/1554469082717?e=1718841600&v=beta&t=8mGbCXPompP-rAcsC-w0Ok2xF8bcwqvD1IblLfry9oI)
While most Americans think of the US as being a country of great economic mobility and opportunity, its economic mobility rate is now one of the worst in the developed world for the bottom. As shown below, in the US, people in the bottom income quartile have a 40% chance of having a father in the bottom quartile (in the father’s prime earning years) and people in the top quartile have only about an 8% chance of having a father in the bottom quartile, suggesting half of the average probability of moving up and one of the worst probabilities of the countries analyzed. In a country of equal opportunity, that would not exist.
![[x]](https://media.licdn.com/dms/image/C4D12AQHFZ-YyNaFPrw/article-inline_image-shrink_1000_1488/0/1554471323042?e=1718841600&v=beta&t=CAFK7xH3n7oQKqLCEI6KVaTfmzvZP4IspfVgkQHCHnI)
One’s income growth results from one’s productivity growth, which results from one’s personal development. So let’s look at how we are developing people. Let’s start with children.
To me, the most intolerable situation is how our system fails to take good care of so many of our children. As I will show, a large number of them are poor, malnourished (physically and mentally), and poorly educated. More specifically:
- The childhood poverty rate in the US is now 17.5% and has not meaningfully improved for decades.[xi] In the US in 2017, around 17% of children lived in food-insecure homes where at least one family member was unable to acquire adequate food due to insufficient money or other resources.[xii] Unicef reports that the US is worse than average in the percent of children living in a food-insecure household (with the US faring worse than Poland, Greece, and Chile).[xiii]
The domino effects of these conditions are costly. Low incomes, poorly funded schools, and weak family support for children lead to poor academic achievement, which leads to low productivity and low incomes of people who become economic burdens on the society.
Though there are bright spots in the American education system such as our few great universities, the US population as a whole scores very poorly relative to the rest of the developed world in standardized tests for a given education level. More specifically:
- Looking at the most respected (PISA) test scores, the US is currently around the bottom 15th percentile of the developed world. As shown below, the US scores lower than virtually all developed countries other than Italy and Greece. That stands in the way of many people having adequate living standards and of US competitiveness.
![[xiv]](https://media.licdn.com/dms/image/C4D12AQGqKRvzQ_mHhA/article-inline_image-shrink_1000_1488/0/1554469241413?e=1718841600&v=beta&t=B8w3fZxPPsLtMAsSMDgD43-U7OF9vb66wXgjOEQ-LLk)
Differences in these scores are tied to poverty levels—i.e., high-poverty schools (measured by the share of students eligible for free/reduced-price lunch) have PISA test scores around 25% lower than schools with the lowest levels of poverty.
![[xv]](https://media.licdn.com/dms/image/C4D12AQHwDx-3Gr49Cw/article-inline_image-shrink_1000_1488/0/1554469275057?e=1718841600&v=beta&t=KspCd3Mtrs6FtQFbUhxAHvigohzzZrItf-UMI2ElOss)
- Among developed (i.e., OECD) countries, the US has the third-worst difference in shortages of teaching staff between advantaged and disadvantaged schools.
![[xvi]](https://media.licdn.com/dms/image/C4D12AQG-508I_23xUw/article-inline_image-shrink_1000_1488/0/1554469333951?e=1718841600&v=beta&t=XwjjGu33F0yozePJB3h0T5iL10SzNBpo7iV2Zyj__b4)
The stats that show that the US does a poor job of tending to the needs of its poor students relative to how most other countries do it are never-ending. Here are a few more:
- The proportion of disadvantaged students who have at least a year of pre-primary education is lower in the US compared to the average OECD country.[xvii]
- Among OECD countries, the US has the second-worst child poverty rate as of 2008 among single-parent households who aren’t working—a failure of the social safety net.[xviii]
These poor educational results lead to a high percentage of students being inadequately prepared for work and having emotional problems that become manifest in damaging behaviors. Disadvantaged students in the US are far more likely to report social and/or emotional issues than in most other developed countries, including not being socially integrated at school, severe test anxiety, and low satisfaction with life.
![[xix]](https://media.licdn.com/dms/image/C4D12AQE6utv4HS9-HA/article-inline_image-shrink_1000_1488/0/1554469470906?e=1718841600&v=beta&t=xdNm9-zcOwyzaIUEcFfEG--kEfqy4MW7ozZne6-aApw)
- 34% of high-poverty schools experienced high levels of chronic student absence, versus only 10% of high-income schools.[xx] Even in Connecticut, one of the wealthiest states by per capita income, 22% of youth are disengaged (i.e., either missing more than 25 days of school a year, failing two or more courses, or being suspended multiple times) or disconnected (young people not enrolled in school and without a high school degree).[xxi] Disconnected youth in Connecticut are five times more likely to end up incarcerated and 33% more likely to be struggling with substance abuse (full report linked here).
- Comparing the high school graduation rates of Connecticut school districts to child poverty rates shows a tight relationship across the state: a 1% higher child poverty rate equates to about 1% lower graduation rates.
![[xxii]](https://media.licdn.com/dms/image/C4D12AQGCJwd57TABJw/article-inline_image-shrink_1000_1488/0/1554469642742?e=1718841600&v=beta&t=6eYaYeV1Z3eJJJPFElojZSPzIHYXLewS2igCqYM_BLo)
- Across states, there is a strong relationship between spending per student and educational outcomes.
Scatters of Educational Spending and Outcomes for US States
![[xxiii]](https://media.licdn.com/dms/image/C4D12AQFx2vx_59QEQg/article-inline_image-shrink_400_744/0/1554469677602?e=1718841600&v=beta&t=Snl1fE8nRghpAhuTSlNjeUoDhPK7UiKxfI0ISLmLxtk)
- Recent research for the US suggests that children under age 5 who were granted access to food stamps experienced better health and education outcomes—an estimated 18% increase in high school graduation rates—which led them to be much less likely to rely on other welfare programs later in life.[xxiv]
- Students who come from poor families and try to go to college are less well prepared. For example, those who come from families earning less than $20,000 score on average 260 points (out of 1600) worse on the SAT than students from families earning $200,000+ do, and the gap is increasing.[xxv] The gap in test scores between children at the top and bottom of the income distribution is estimated to be 75% higher today than it was in the early 1940s, according to a 2011 study.[xxvi]
- Yet children living in poorer neighborhoods on average receive about $1,000 less state and local funding per student than those in the more prosperous neighborhoods.[xxvii] This is despite the fact that the federal government (according to its Title I funding formula) assumes it costs a district 40% more per year to educate lower-income students to the same standard as typical students.[xxviii] As a result, schools in low-income areas are typically severely underfunded. On average, in public schools 94% of teachers have to pay for supplies with their own money—often including basic cleaning supplies—and it is worse in the poorest public schools.[xxix]
- A related problem is that many teachers who have to deal with these stressful conditions are underpaid and under-respected. When I was growing up, doctors, lawyers, and teachers were the most respected professions. Now, teachers make only 68% of what other university graduates make, which is significantly less than they make in other OECD developed countries.[xxx] Even looking at weekly earnings to adjust for the length of the school year and controlling for other things that impact pay (like age and years of experience), teachers earned 19% less than comparable workers in 2017, versus only 2% less in 1994.[xxxi] Even worse, they don’t get the respect that they deserve.
The income/education/wealth/opportunity gap reinforces the income/education/wealth/opportunity gap:
- Richer communities tend to have public schools that are far better funded than poorer communities, which reinforces the income/wealth/opportunity gap. One of the main reasons for this funding gap is that the Constitution made education a state issue, and most states made local schools primarily locally funded so that rich towns have well-funded public schools and poor towns have poorly funded public schools. More specifically, around 45% of school funding comes from local governments, primarily through property taxes, while only around 8% comes from the federal government, and the rest is from state governments.[xxxii] Thus, there can be enormous variations in the wealth/income of individual communities. Also, the top 40% of income earners spend almost five times as much on their children’s education as the bottom 60% of income earners do, while those in the top 20% spend about six times as much as those in the bottom 20% do.[xxxiii]
- Underfunded public schools are suffering in quality. For instance, PISA data shows that students at US schools with significant teaching staff shortages score 10.5% worse on testing than students at schools with no teacher shortages. Similarly, a shortage of lab equipment is associated with a 16.7% drop in student scores, and shortages of library materials are associated with a 15.1% drop in student scores.[xxxiv]
- By comparison, private schools on average both spend considerably more on students and produce better outcomes. Private schools in the US spend about 70% more per student than public schools do, with the median private school spending about $23,000 per student in 2016, compared to about $14,000 for the average public school.[xxxv] This higher spending translates to higher test scores: in the last round of PISA testing, US private school students scored on average 4.3% higher than public school students across math, reading, and science exams. Over the three PISA surveys since 2009, private school students have scored on average 6.9% higher.[xxxvi]
- Not surprisingly, Americans have much less confidence in public schools today than they have had at any point over the last five decades. Today, only 29% of Americans have a “great deal” or “quite a lot” of trust in the public education system. In 1975, 62% of Americans trusted public schools.[xxxvii]
To me, leaving so many children in poverty and not educating them well is the equivalent of child abuse, and it is economically stupid.
The weakening of the family and good parental guidance has also been an important adverse influence:
Here are a few stats that convey how the family unit has changed over the years:
- In 1960, 73% of children lived with two married parents who had never been divorced, and 13% lived in a household without two married parents.[2] In 2014, the share of children living in a household without two married parents was 38% (and now less than half live in households with two parents in a first marriage). Those stats are for the average of all households in the US. The family support for those in low-education, low-income households is much less. Around 60% of children of parents with less than high school education don’t live in households with two married parents, while only 14% of children of parents who graduated college are in such households.[xxxviii]
- The probability of being incarcerated is closely related to education levels: among Americans aged 28-33, 35% of male high school dropouts have been incarcerated versus around 10% of male high school graduates and only 2% of male college graduates.[xxxix]
- Between 1991 and 2007, the number of children with a parent in state or federal prison grew 80%.[xl] Today, an estimated 2.7 million children in the US have a parent in prison or jail—that is 1 in every 28 children (3.6% of all children).[xli]
Bad childcare and bad education lead to badly behaved adults hence higher crime rates that inflict terrible costs on the society:
- The United States’ incarceration rate is nearly five times the average of other developed countries and three times that of emerging countries.[xlii] The direct cost of keeping people incarcerated is staggering and has grown rapidly: state correctional costs quadrupled over the past two decades and now top $50 billion a year, consuming 1 in every 15 general fund dollars.[xliii]
- This bad cycle perpetuates itself as criminal/arrest records make it much more difficult to find a job, which depresses earnings. Serving time, even relatively brief periods, reduces hourly wages for men by approximately 11%, the time employed by 9 weeks per year, and annual earnings by 40%.[xliv]
The health consequences and economic costs of low education and poverty are terrible:
- For example, for those in the bottom 60% premature deaths are up by about 20% since 2000.[xlv] Men from the lowest 20% of the income distribution can expect to live about 10 fewer years than men from the top 20%.[xlvi]
- The US is just about the only major industrialized country with flat/slightly rising premature death rates. The biggest contributors to that change are an increase in deaths by drugs/poisoning (having more than doubled since 2000) and an increase in suicides (up over 50% since 2000).[xlvii]
- Since 1990, the share of Americans who say that in the last year they put off medical treatment for a serious condition because of cost has roughly doubled, from 11% in 1991 to 19% today.[xlviii]
- Those who are unemployed or those making less than $35,000 per year have worse health, with 20% of each group reporting poor health, about three times the rate for the rest of the population.[xlix]
- The impacts of childhood poverty alone in the US are estimated to increase health expenditures by 1.2% of GDP.[L]
These conditions pose an existential risk for the US.
The previously described income/wealth/opportunity gap and its manifestations pose existential threats to the US because these conditions weaken the US economically, threaten to bring about painful and counterproductive domestic conflict, and undermine the United States’ strength relative to that of its global competitors.
These gaps weaken us economically because:
- They slow our economic growth because the marginal propensity to spend of wealthy people is much less than the marginal propensity to spend of people who are short of money.
- They result in suboptimal talent development and lead to a large percentage of the population undertaking damaging activities rather than contributing activities.
In addition to social and economic bad consequences, the income/wealth/opportunity gap is leading to dangerous social and political divisions that threaten our cohesive fabric and capitalism itself.
I believe that, as a principle, if there is a very big gap in the economic conditions of people who share a budget and there is an economic downturn, there is a high risk of bad conflict. Disparity in wealth, especially when accompanied by disparity in values, leads to increasing conflict and, in the government, that manifests itself in the form of populism of the left and populism of the right and often in revolutions of one sort or another. For that reason, I am worried what the next economic downturn will be like, especially as central banks have limited ability to reverse it and we have so much political polarity and populism.
The problem is that capitalists typically don’t know how to divide the pie well and socialists typically don’t know how to grow it well. While one might hope that when such economic polarity and poor conditions exist, leaders would pull together to reform the system to both divide the economic pie and make it grow better (which is certainly doable and the best path), they typically become progressively more extreme and fight more than cooperate.
In order to understand the phenomenon of populism, two years ago I did a study of it in which I looked at 14 iconic cases and observed the patterns and the forces behind them. If you are interested in it, you can read it here. In brief, I learned that populism arises when strong fighters/leaders of the right or of the left who are looking to fight and defeat the opposition come to power and escalate their conflict with the opposition, which typically galvanizes around comparably strong/fighting leaders. The most important thing to watch as populism develops is how conflict is handled—whether the opposing forces can coexist to make progress or whether they increasingly “go to war” to block and hurt each other and cause gridlock. In the worst cases, this conflict causes economic problems (e.g., via paralyzing strikes and demonstrations) and can even lead to moves from democratic leadership to autocratic leadership as happened in a number of countries in the 1930s.
We are now seeing conflicts between populists of the left and populists of the right increasing around the world in much the same way as they did in the 1930s when the income and wealth gaps were comparably large. In the US, the ideological polarity is greater than it has ever been and the willingness to compromise is less than it’s ever been. The chart on the left shows how conservative Republican senators and representatives have been and how liberal Democratic senators and representatives have been going back to 1900. As you can see, they are each more extreme and they are more divided than ever before. The chart on the right shows what percentage of them have voted along party lines going back to 1790, which is now the greatest ever. In other words, they have more polar extreme positions and they are more solidified in those positions than ever. And we are coming into a presidential election year. We can expect a hell of a battle.

![[li]](https://media.licdn.com/dms/image/C4D12AQE4RdKbeVSihg/article-inline_image-shrink_400_744/0/1554470664927?e=1718841600&v=beta&t=BtVAEc97h0gx6gTibwINB-12DpIwMrj2C4J_Foc4P2M)
It doesn’t take a genius to know that when a system is producing outcomes that are so inconsistent with its goals, it needs to be reformed. In the next part, I will explore why it is producing these substandard outcomes and what I think should be done to reform it.
Part 2
My Diagnosis of Why Capitalism Is Now Not Working Well for the Majority of People
I believe that reality works like a machine with cause/effect relationships that produce outcomes, and that when the outcomes fall short of the goals one needs to diagnose why the machine is working inadequately and then reform it. I also believe that most everything happens over and over again through history, and by observing and thinking through these patterns one can better understand how reality works and acquire timeless and universal principles for dealing with it better. I believe that the previously shown outcomes are unacceptable, so that we first need to look at how the economic machine is producing these outcomes and then think about how to reform it.
Contrary to what populists of the left and populists of the right are saying, these unacceptable outcomes aren’t due to either a) evil rich people doing bad things to poor people or b) lazy poor people and bureaucratic inefficiencies, as much as they are due to how the capitalist system is now working.
I believe that all good things taken to an extreme become self-destructive and everything must evolve or die, and that these principles now apply to capitalism. While the pursuit of profit is usually an effective motivator and resource allocator for creating productivity and for providing those who are productive with buying power, it is now producing a self-reinforcing feedback loop that widens the income/wealth/opportunity gap to the point that capitalism and the American Dream are in jeopardy. That is because capitalism is now working in a way in which people and companies find it profitable to have policies and make technologies that lessen their people costs, which lessens a large percentage of the population’s share of society’s resources. Those companies and people who are richer have greater buying power, which motivates those who seek profit to shift their resources to produce what the haves want relative to what the have-nots want, which includes fundamentally required things like good care and education for the have-not children. We just saw this exemplified in the college admissions cheating scandal.
As a result of this dynamic, the system is producing self-reinforcing spirals up for the haves and down for the have-nots, which are leading to harmful excesses at the top and harmful deprivations at the bottom. More specifically, I believe that:
- The pursuit of profit and greater efficiencies has led to the invention of new technologies that replace people, which has made companies run more efficiently, rewarded those who invented these technologies, and hurt those who were replaced by them. This force will accelerate over the next several years, and there is no plan to deal with it well.
- The pursuit of greater profits and greater company efficiencies has also led companies to produce in other countries and to replace American workers with cost-effective foreign workers, which was good for these companies’ profits and efficiencies but bad for the American workers’ incomes. Of course, this globalization also allowed less expensive and perhaps better quality foreign goods to come into the US, which has been good for both the foreign sellers and the American buyers of them and bad for the American companies and workers who compete with them.
Because of these two forces, the share of revenue that has gone to profits has increased relative to the share that has gone to the worker. The charts below show the percentage of corporate revenue that has gone to profits and the percentage that has gone to employee compensation since 1929.

![[lii]](https://media.licdn.com/dms/image/C4D12AQGIKgvbZmaycg/article-inline_image-shrink_400_744/0/1554470835568?e=1718841600&v=beta&t=Wtcq0DbJHAZ7amn1_OwcL5IngV_U8MWVuHri2aDMOXc)
3. Central banks’ printing of money and buying of financial assets (which were necessary to deal with the 2008 debt crisis and to stimulate economic growth) drove up the prices of financial assets, which helped make people who own financial assets richer relative to those who don’t own them. When the Federal Reserve (and most other central banks) buys financial assets to put money in the economy in order to stimulate the economy, the sellers of those financial assets (who are rich enough to have financial assets) a) get richer because the financial asset prices rise and b) are more likely to buy financial assets than to buy goods and services, which makes the rich richer and flush with money and credit while the majority of people who are poor don’t get money and credit because they are less creditworthy. From being in the investment business, I see that there is a glut of investment money chasing investments at the same time as there is an extreme shortage of money among most people. In other words, money is clogged at the top because if you’re one of those who has money or good ideas of how to make money you can have more money than you need because lenders will freely lend it to you and investors will compete to give it to you. On the other hand, if you’re not in financially good shape nobody will lend to you or invest in you and the government doesn’t help materially because the government doesn’t do that.
4. Policy makers pay too much attention to budgets relative to returns on investments. For example, not spending money on educating our children well might be good from a budget perspective, but it’s really stupid from an investment perspective. Looking at the funding through a budget lens doesn’t lead one to take into consideration the all-in economic picture—e.g., it doesn’t take into consideration the all-in costs to the society of having poorly educated people. While focusing on the budget is what fiscal conservatives typically do, fiscal liberals have typically shown themselves to borrow too much money and fail to spend it wisely to produce the economic returns that are required to service the debts they have taken on, so they often end up with debt crises. The budget hawk conservatives and the pro-spending/borrowing liberals have trouble focusing on, working together for, and achieving good “double bottom line” return on investments (i.e., investments that produce both good social returns and good economic returns).
What I Think Should Be Done
For the previously explained reasons, I believe that capitalism is a fundamentally sound system that is now not working well for the majority of people, so it must be reformed to provide many more equal opportunities and to be more productive. To make the changes, I believe something like the following is needed.
- Leadership from the top. I have a principle that you will not effect change unless you affect the people who have their hands on the levers of power so that they move them to change things the way you want them to change. So there need to be powerful forces from the top of the country that proclaim the income/wealth/opportunity gap to be a national emergency and take on the responsibility for reengineering the system so that it works better.
- Bipartisan and skilled shapers of policy working together to redesign the system so it works better. I believe that we will do this in a bipartisan and skilled way or we will hurt each other. So I believe the leadership should create a bipartisan commission to bring together skilled people from different communities to come up with a plan to reengineer the system to simultaneously divide and increase the economic pie better. That plan will show how to raise money and spend/invest it well to produce good double bottom line returns.
- Clear metrics that can be used to judge success and hold the people in charge accountable for achieving it. In running the things I run, I like to have clear metrics that show how those who are responsible for things are doing and have rewards and punishments that are based on how these metrics change. Having these would produce the accountability and feedback loop that are required to achieve success. To the extent possible, I’d bring that sort of accountability down to the individual level to encourage an accountability culture in which individuals are aware of whether they are net contributors or net detractors to the society, and the individuals and the society make attempts to make them net contributors.
- Redistribution of resources that will improve both the well-beings and the productivities of the vast majority of people. As an economic engineer, naturally I think about how money might be obtained from taxes, borrowing, businesses, and philanthropy, and how it would flow to affect prices and economies. For example, I think about how a change in personal tax rates might occur and how changes in them relative to corporate tax rates would affect how money would flow, and how changes in tax rates in one location relative to another location would drive flows and outcomes in them. I also think a lot about how the money raised will be spent—e.g., how much will be spent on programs that will improve both social and economic outcomes, and how much will be redistributive. Such decisions would of course be up to the people on the bipartisan commission and the leadership to decide and are way too complicated an engineering exercise for me to opine on here. I can, however, give my big picture inclinations. Above all else, I’d want to achieve good double bottom line results. To do that I’d:
a. Create private-public partnerships (including governments, philanthropists, and companies) that would jointly vet and invest in double bottom line projects that would be judged on the basis of their social and economic performance results relative to clear metrics. That would both increase the funding for and the quality of projects because people who have to put their own money on the line would be responsible for them. (For examples, see the Appendix.)
b. Raise money in ways that both improve conditions and improve the economy’s productivity by taking into consideration the all-in costs for the society (e.g., I’d tax pollution and various causes of bad health that have sizable economic costs for the society).
c. Raise more from the top via taxes that would be engineered to not have disruptive effects on productivity and that would be earmarked to help those in the middle and the bottom primarily in ways that also improve the economy’s overall level of productivity, so that the spending on these programs is largely paid for by the cost savings and income improvements that they create. Having said that, I also believe that the society has to establish minimum standards of healthcare and education that are provided to those who are unable to take care of themselves.
5. Coordination of monetary and fiscal policies. Because money is clogged at the top and because the capacity of central banks to ease enough to reverse the next economic downturn is limited, fiscal policy will have to be more coordinated with monetary policy, which can happen while maintaining the Federal Reserve’s independence. If done well, this will both stimulate economic growth and reduce the effects that quantitative easing has on increasing the wealth gap by shifting money and credit into the hands of those who have a higher propensity to spend from those who have a higher propensity to save and from those who need it less to those who need it more.
Looking Ahead
In assessing the position we are in, we can look at both cause-effect relationships and historical comparisons. The most relevant causes that are leading to the effects we are seeing are:
- The high debt levels that led to the 2008 debt crisis (and have since increased) led to…
- Central banks printing a lot of money and buying financial assets, which pushed asset prices up and pushed interest rates down. This has benefited those with financial assets (i.e., the haves) and has left central banks with less power to stimulate the economy.
- These factors and new technologies created very wide income/wealth/opportunity and values gaps, which are expected to increase and are leading to…
- Increased populism of the left and populism of the right that are causing greater domestic and international conflicts at the same time as…
- There is a rising power (China) to compete with the existing dominant world power (the United States), which will lead to competitions that will be economic, ideological, and military and will be determined by the two powers' relative skills and technological abilities. This competition will establish what the new world order will be like vis-à-vis the rest of the world.
The last time that this configuration of influences existed was in the late 1930s when there were great conflicts and economic and political systems were overturned. For the fundamental reasons explained earlier, I believe that we are at the sort of critical juncture in which the biggest issue will be how we deal with each other rather than any other constraints.
There are enough resources to go around to deal with the risky issues and produce much more equal opportunity plus improved productivity that will grow the pie. My big worry is that the sides will be intransigent in their positions so that capitalism will either a) be abandoned or b) not be reformed because those on the right will fight for keeping it as it is and those on the left will fight against it. So to me, the biggest questions are a) whether populists of the right or populists of the left will gain control and/or have conflicts that will adversely affect the operations of government, the economy, and international relations or b) whether sensible and skilled people from all sides can work together to reform the system so it works well for the majority of people.
We will soon know a lot more about which paths are most likely because over the next two years there will be defining elections in the US, the UK, Italy, Spain, France, Germany, and the European Parliament. How they turn out will have significant effects on how the conflicts raised in this report will be dealt with, which will influence how money will flow between people, markets, states, and countries and will determine the relative strengths of most people and countries. I will be paying close attention to all this and will keep you informed.
Appendix: My Perspective On Double Bottom Line Investing
I felt that I should give some examples of good double bottom line investing so that’s what this appendix is about. From doing my philanthropic work, I see great double bottom line investments all the time, and I only see a small percentage of them so I know that there are vastly more. Since my wife and I focus especially in education and microfinance, my window is more in these areas than elsewhere though we have been exposed to many in other areas such as healthcare, the reform of the criminal justice system, environmental protection, etc. For example, a few of the good double bottom line investments that I came across are:
- Early childhood education programs that produce returns of about 10-15% annualized in the form of cost savings for the government when one accounts for the lifetime benefits for the students and society. That is because they lead to better school performance, higher earnings, and lower odds of committing crimes, all of which have direct economic benefits for society.[liii]
- Relatively inexpensive interventions that lead to lower high school dropout rates in grades 8 and 9 can pay for themselves many times over. Moving these young students into practical higher education or trade jobs when done well is highly cost-effective. For example, the lifetime earnings of a college graduate are over $1 million higher than those of a high school dropout.[liv]
- School finance reforms show that a 10% increase in per-pupil spending can have a meaningful impact on educational outcomes for low-income students, producing a higher ROI than spending on higher-income students. Overall, researchers have found that additional school spending has an IRR of roughly 10%.[lv]
- Microfinance. For every dollar donated/invested in this, approximately $12 is lent, paid back, and lent again over the next 10 years to disadvantaged people to start and build their businesses.[lvi]
- Numerous infrastructure spending plans that can facilitate trade and improve productivity/efficiency. From 33 studies that looked at the ROI of infrastructure investment, it is estimated that smart infrastructure programs have a 10-20% rate of return in terms of increased economic activity, making it a good trade for the government to borrow money and invest in infrastructure.[lvii]
- Public health/preventative healthcare interventions also can have very positive ROIs. From 52 studies that looked at the ROI of preventative health programs (covering a variety of program types, including vaccines, home blood pressure monitoring, smoking cessation, etc.), on average the programs created $14 of benefit for every $1 of cost.[lviii]
Since these areas are great double bottom line investments for the country, it would be great if they were brought to scale with government support. I believe that partnerships between philanthropy, government, and business for these types of investments are powerful because they would both increase the amount of funding and result in better vetting of the projects and programs. I know that I see plenty of good deals that I’d love to maximize the funding for that would be cost-effective for governments, other philanthropists, and businesses to support. For example, my wife and our philanthropy team are now working on an agreement in which the Dalio Philanthropies will donate $100 million to programs for the most underfunded school districts and for microfinance in Connecticut if the state donates $100 million and if other philanthropists and businesses in Connecticut also donate another $100 million. That will bring more money, better due diligence, more partnership to our Connecticut community, and positive expected net financial returns (after considering the costs of not educating and supporting our children well) for the benefit of the state.
[1] Actually, we broke it into many other subcategories and then aggregated them into these two groups for simplicity in presenting the results.
[i] https://wir2018.wid.world/part-2.html
[ii] Based on data from the Current Population Survey. https://cps.ipums.org/cps/
[iii] http://www.equality-of-opportunity.org/papers/abs_mobility_paper.pdf, 34.
[iv] As of 2016; based on data from Survey of Consumer Finances.
[v] Income chart (on left) shows fiscal income shares. Data from World Inequality Database. (https://wid.world/country/usa/)
[vi] Data from Census Bureau
[vii] As of 2016; based on data from Survey of Consumer Finances.
[viii] Survey of Consumer Finances (https://www.federalreserve.gov/publications/files/2017-report-economic-well-being-us-households-201805.pdf)
[ix] https://www.minneapolisfed.org/institute/working-papers/17-06.pdf
[x] https://www.oecd.org/social/soc/Social-mobility-2018-Overview-MainFindings.pdf; estimates for China based on Kelly Labar, “Intergenerational Mobility in China”, (https://halshs.archives-ouvertes.fr/halshs-00556982/document). Note that methodologies varied between countries in the OECD study.
[xi] US Census Bureau, Current Population Survey, 1960 to 2018 Annual Social and Economic Supplements, History Poverty Tables, Table 3.(https://www.census.gov/data/tables/time-series/demo/income-poverty/historical-poverty-people.html)
[xii] https://www.ers.usda.gov/webdocs/publications/90023/err-256.pdf, 10.
[xiii] https://www.weforum.org/agenda/2017/06/these-rich-countries-have-high-levels-of-child-poverty/
[xiv] http://www.oecd.org/pisa/data/
[xv] http://www.oecd.org/pisa/data/
[xvi] OECD (2016), PISA 2015 Results (Volume I): Excellence and Equity in Education, PISA, OECD Publishing, Paris, 231.
[xvii] OECD (2017), Educational Opportunity for All: Overcoming Inequality throughout the Life Course, OECD Publishing, Paris, 46.
http://dx.doi.org/10.1787/9789264287457-en
[xviii] OECD (2017), Educational Opportunity for All: Overcoming Inequality throughout the Life Course, OECD Publishing, Paris, 60.
[xx] http://new.every1graduates.org/wp-content/uploads/2018/09/Data-Matters_083118_FINAL-2.pdf
[xxiii] Poverty data from Census Bureau SAIPE School District Estimates (https://www.census.gov/data/datasets/2013/demo/saipe/2013-school-districts.html); graduation rates from Hechinger Report (https://hechingerreport.org/the-gradation-rates-from-every-school-district-in-one-map/)
[xxiv] Note: Spending data is from the US Census Bureau and is current as of 2016. Test scores and proficiency data are from “National Report Card” assessments and are meant to be comparable across states. Data is from 2013. Only a limited sample of states have data for this Grade 12 assessment.
[xxiv] https://www.cbpp.org/research/food-assistance/snap-is-linked-with-improved-nutritional-outcomes-and-lower-health-care
[xxv] https://blogs.wsj.com/economics/2014/10/07/sat-scores-and-income-inequality-how-wealthier-kids-rank-higher/
[xxvi] https://cepa.stanford.edu/sites/default/files/reardon%20whither%20opportunity%20-%20chapter%205.pdf , 8.
[xxvii] https://edtrust.org/wp-content/uploads/2014/09/FundingGapReport_2018_FINAL.pdf, 4.
[xxviii] https://edtrust.org/wp-content/uploads/2014/09/FundingGapReport_2018_FINAL.pdf, 7.
[xxix] https://www.usatoday.com/story/money/personalfinance/2018/05/15/nearly-all-teachers-spend-own-money-school-needs-study/610542002/
[xxx] OECD (2017), "D3.2a. Teachers' actual salaries relative to wages of tertiary-educated workers (2015)", in The Learning Environment and Organisation of Schools, OECD Publishing, Paris, https://doi.org/10.1787/eag-2017-table196-en.
[xxxi] https://www.epi.org/publication/teacher-pay-gap-2018/
[xxxii] https://nces.ed.gov/programs/coe/indicator_cma.asp
[xxxiii] Data based on Consumer Expenditure Survey
[xxxiv] http://www.oecd.org/pisa/data/
[xxxv] Private school spending data from: https://www.nais.org/statistics/pages/nais-independent-school-facts-at-a-glance/ ; Public school spending data from: https://www.statista.com/statistics/203118/expenditures-per-pupil-in-public-schools-in-the-us-since-1990/
[xxxvi] http://www.oecd.org/pisa/data/
[xxxvii] https://news.gallup.com/poll/1612/education.aspx
[2] The remaining 14% lived with two parents in remarriages.
[xxxviii] http://www.pewsocialtrends.org/2015/12/17/1-the-american-family-today/
[xxxix] https://www.brookings.edu/research/twelve-facts-about-incarceration-and-prisoner-reentry/, 10
[xli] The Pew Charitable Trusts, Collateral Costs: Incarceration’s Effect on Economic Mobility, https://www.pewtrusts.org/~/media/legacy/uploadedfiles/pcs_assets/2010/collateralcosts1pdf.pdf, 4.
[xlii] Calculations based on data from “World Prison Brief Database.” (http://www.prisonstudies.org/highest-to-lowest/prison_population_rate?field_region_taxonomy_tid=All)
[xliii] https://www.pewtrusts.org/~/media/legacy/uploadedfiles/pcs_assets/2010/collateralcosts1pdf.pdf, 2.
[xliv] https://www.pewtrusts.org/~/media/legacy/uploadedfiles/pcs_assets/2010/collateralcosts1pdf.pdf, 4.
[xlv] As of 2015; Bridgewater analysis, based on data from the CDC (https://www.cdc.gov/nchs/data_access/VitalStatsOnline.htm#Mortality_Multiple)
[xlvi] Chetty, Raj, et al., “The Association Between Income and Life Expectancy in the United States, 2001-2014”, Journal of the American Medical Association, 2016.
[xlvii] As of 2015; Bridgewater analysis, based on data from the CDC (https://www.cdc.gov/nchs/data_access/VitalStatsOnline.htm#Mortality_Multiple)
[xlviii] https://news.gallup.com/poll/4708/healthcare-system.aspx
[xlix] https://ftp.cdc.gov/pub/Health_Statistics/NCHS/NHIS/SHS/2014_SHS_Table_A-11.pdf
[l] https://www.americanprogress.org/issues/poverty/reports/2007/01/24/2450/the-economic-costs-of-poverty/
[li] https://voteview.com/data
[lii] Based on data from the Bureau of Economic Analysis
[liii] https://heckmanequation.org/resource/research-summary-lifecycle-benefits-influential-early-childhood-program/
[liv] http://cdn.ey.com/parthenon/pdf/perspectives/Parthenon-EY_Untapped-Potential_Dalio-Report_final_092016_web.pdf
[lv] For the purposes of this study, “low-income” students were defined as students whose family income was below 2x the poverty line at any point during their childhood. The study’s projections are based on comparing the life outcomes of children that were impacted by major school finance reforms in 28 states between 1971 and 2010 with those of similar children who were unaffected by the reforms. See https://academic.oup.com/qje/article/131/1/157/2461148
[lvi] Sourced from Grameen America standard 26-week loan amortization schedule, assuming full reinvestment of principal repayments over 5 years
[lvii] https://www.epi.org/publication/the-potential-macroeconomic-benefits-from-increasing-infrastructure-investment/
[lviii] https://www.ncbi.nlm.nih.gov/pmc/articles/PMC5537512/
