風蕭蕭_Frank
以文會友


The Fed - The Outlook for the U.S. Economy - Federal Reserve Bank
美聯儲主席談美國經濟挑戰:生產率低迷,已接近二戰以來最低
|
|
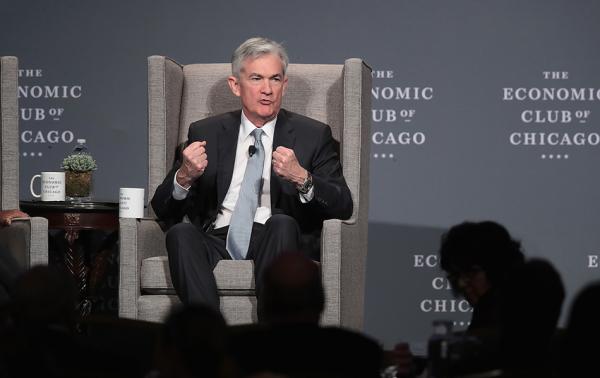
當地時間2018年4月6日,美國芝加哥,美聯儲主席鮑威爾在芝加哥經濟俱樂部發表題為“美國經濟前景展望”的演講。視覺中國 圖
中美貿易爭端風雲迭起,美聯儲主席則一方麵強調了美聯儲日漸穩健中性的貨幣政策立場,另一方麵也表達了對美國經濟長期生產率增長緩慢的擔憂。
當地時間4月6日,美聯儲主席鮑威爾在芝加哥經濟俱樂部發表題為“美國經濟前景展望”的演講,這也是鮑威爾第一次在公開場合就美國經濟和美聯儲貨幣政策進行全麵分析。
鮑威爾介紹,美國經濟已基本處於充分就業狀態,就業市場有望繼續保持強勁增長。盡管通脹率仍低於美聯儲目標,但鮑威爾預計通脹率將在未來幾個月上升,並在中期內達到2%的目標。他說,美聯儲官員對通脹率上升的信心有所增強。
但是與此同時,他也指出經濟長期來看美國麵臨諸多挑戰,最主要的問題體現在勞動參與率和生產率低迷,後者已接近二戰後的最低水平。
貨幣政策方麵,鮑威爾強調了美聯儲穩健中性的立場,他表示,如果美國經濟繼續保持現在的增長勢頭,美聯儲進一步漸進加息是合適的。加息過慢有可能導致經濟過熱,而加息太快則可能抑製通脹率回升,保持漸進的加息節奏可以避免這兩種風險。
針對美國政府提高關稅的計劃,鮑威爾表示,有企業表示貿易政策的變化給其中期經營前景帶來風險,但目前關稅計劃尚未實施,其規模仍存在不確定性。
鮑威爾未對中美的貿易爭端作出評價。同日,舊金山聯儲銀行主席威廉姆斯表示,具體的貿易行動並未給經濟造成巨大影響。如果爆發貿易戰,將給美國經濟造成極大的破壞,可能導致通脹攀升。威廉姆斯即將於6月18日就任紐約聯儲主席。
接下來的一周,中美貿易博弈仍將是多方關注的熱點,而美聯儲3月會議紀要也將發布。
以下為演講全文:
90多年來,芝加哥經濟俱樂部為現在以及未來的領袖們提供了一個討論攸關國家利益的重要平台。我很榮幸今天在這裏發言。
在美聯儲,我們致力於使我們的經濟體足夠強勁以使個人、家庭和工商業都受益。國會授予我們的最重要目標——最大就業和物價穩定。今天我將談談最近的經濟發展狀況,主要是勞動力市場和通脹的情況,長期的增長展望,以及貨幣政策。
美國最近的經濟發展狀況
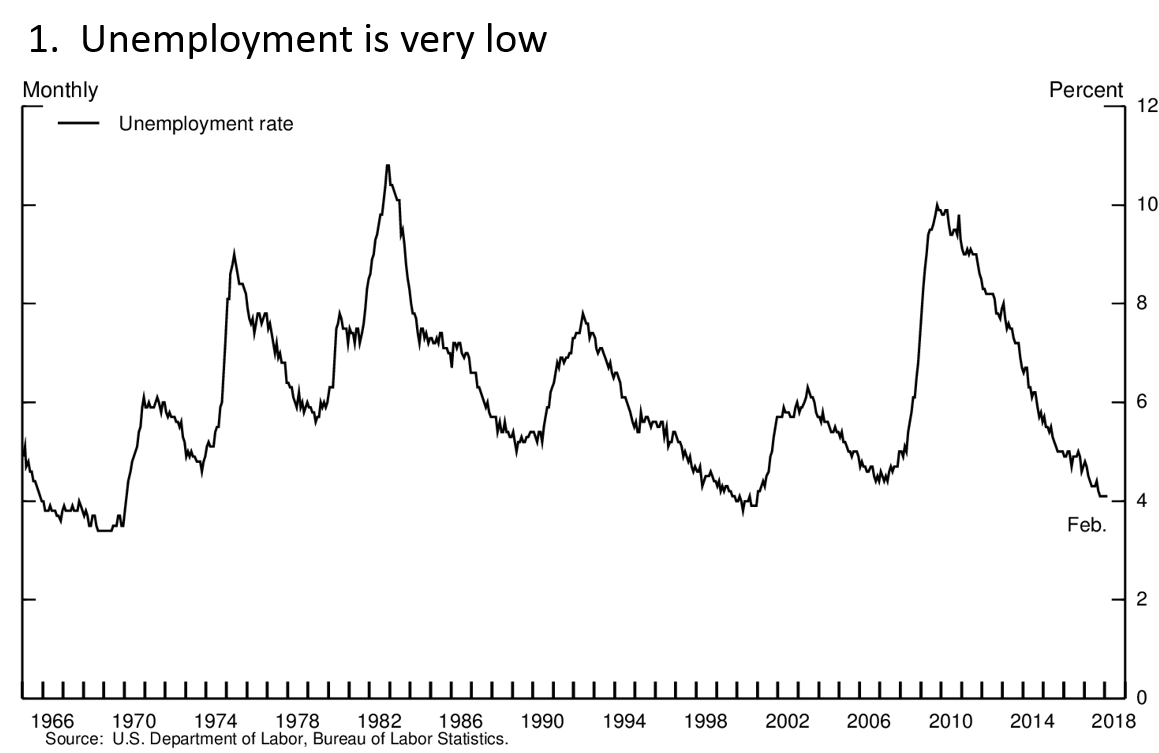
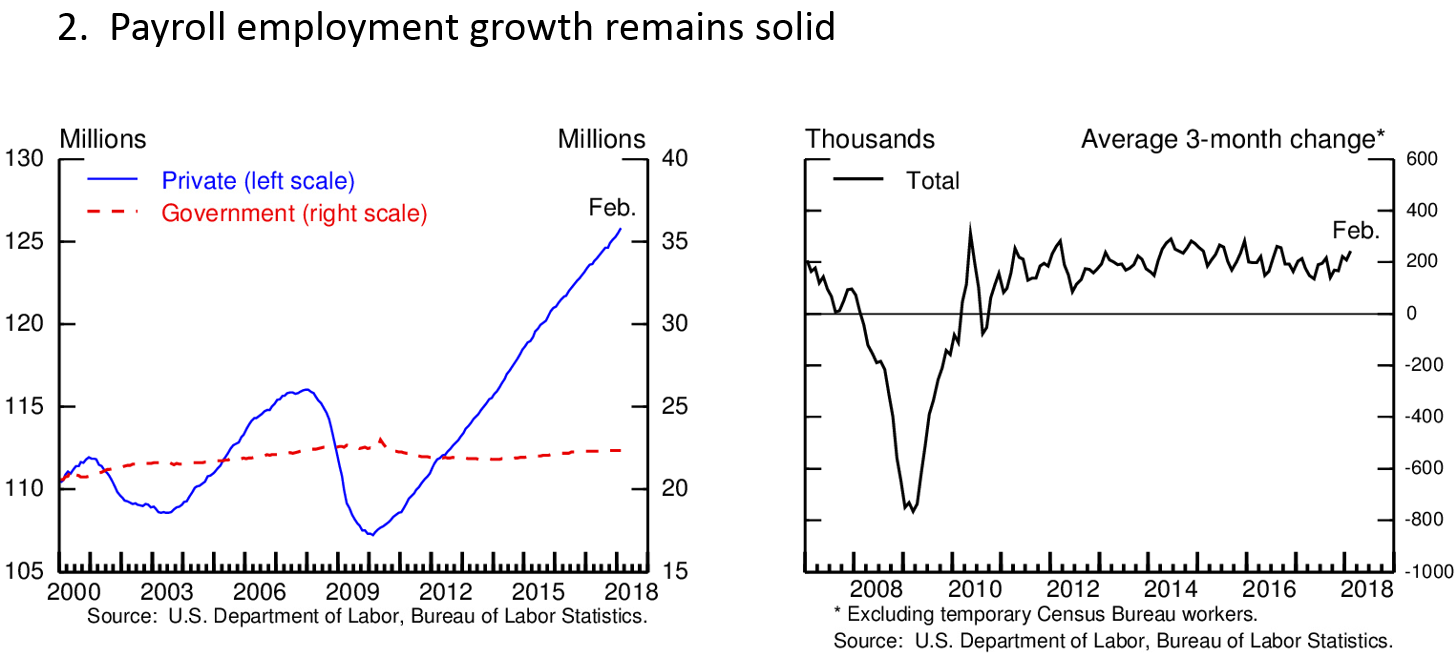
金融危機後,美國經濟在緩慢複蘇。失業率在2009年10月達到10%的曆史最高值,而現在已經回落到了4.1%,是20年來的最低值。在這一輪的擴張中已經新增了1700萬就業,目前的就業月新增速度完全能滿足新進入勞動力市場的數目。勞動力市場非常強勁,我與我的同事,以及公開市場委員會(FOMC)也希望它能保持強勁。通脹水平持續低於FOMC2%的目標,暗示我們希望在未來幾個月內這個指標能有所上升,並在中期內穩定在2%左右。
除了勞動力市場,也有其他的指標顯示經濟正強勁複蘇。收入穩步增加,家庭財富增長,消費者信心也在上升,持續支撐消費支出,達到了經濟產出的三分之二。工商業投資在持續兩年的低迷後,去年也顯著改善。財政刺激和寬鬆的金融環境為家庭支出和商業投資提供了有利支撐,全球經濟強勁增長也刺激了美國的出口。
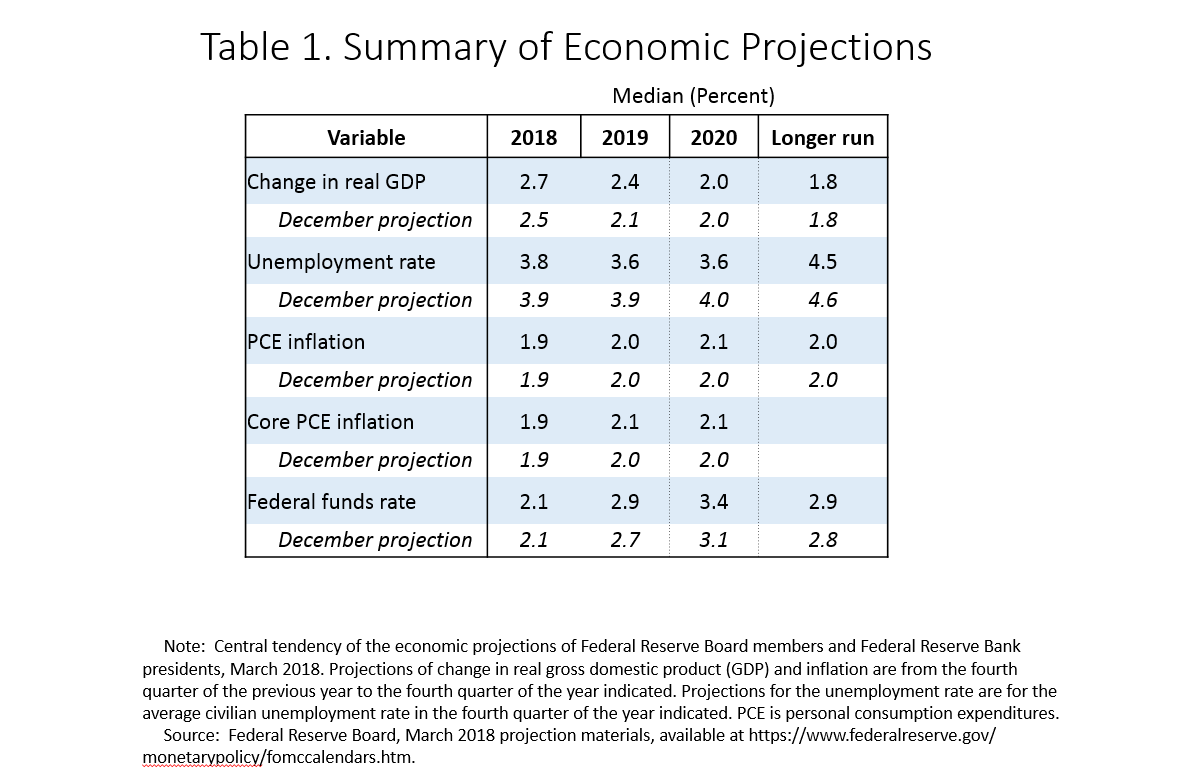
正如在座所知,每個季度FOMC成員會提交哥們各自對增長、就業、通脹和加息路徑的預測,這也是委員會製定貨幣政策的最主要工具。每個人的預測會匯編成《經濟預測梗概》(Summary of Economic Projections)發布,FOMC成員需要提前三個星期提交他們的預測結果,也呈現出中期經濟前景強勁,也普遍提升了經通脹調整的國內生產總值(GDP)增長預期,也調低了對失業率的預測。此外,很多成員對於通脹回升至2%的信心也在增強。經濟增長的前景是較為平衡的。
勞動力市場的狀況
正如我剛才提到的,失業率已經降到了2000年左右的水平。3月SEP的中期預測認為失業率在接下來一段時還會跌落4%,這也是20世紀60年帶來未曾出現過的。這個強有力的信號對美聯儲的兩個任務非常重要,也對美聯儲製定貨幣政策影響重大。
“最大就業”意味著委員會要將勞動力資源最大化。長期來看,最大就業水平不由貨幣政策決定,而是由勞動力市場的結構和動力決定。而且最大就業不可直接測量得到,它會持續變化。對最大就業的實時評估是高度不確定的。鑒於此,FOMC並不設置固定的最大就業目標,而是測量這個指標的範圍,評估經濟狀況在多大程度稱接近最大就業。失業率是最好的衡量勞動力市場的單一指標。目前失業率為4.1%,略微低於FOMC預測的長期失業率中位數。
但是,隻看失業率是不行的。按照官方對失業的定義,必須在過去的4個星期中處於積極找工作的狀態。如果沒有在找工作,就不算是失業。但是從勞動力市場來看,有些人想要工作,也可以工作,而有些在做兼職工作的有可能想要一份全職工作。有些不想要工作的,可能看到有好的機會也加入到勞動力市場中來了。所以,在判斷勞動力市場鬆緊時,我們要看很多其他數據,包括失業率的測量方法,包括空餘工作崗位,家庭和商業對勞動力市場的感受以及薪資和物價水平。
|
|
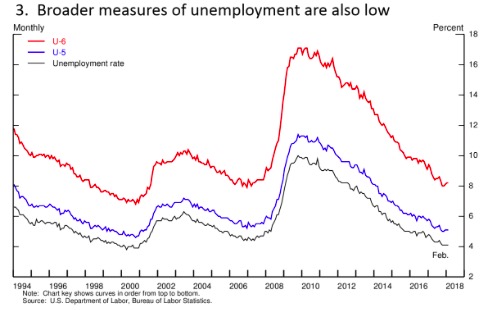
失業率與U5、U6。U5包括失業的與過去1年中都在找工作的人數,U6包括U5和那些正在做兼職且在找全職工作的人數。來源:美聯儲網站
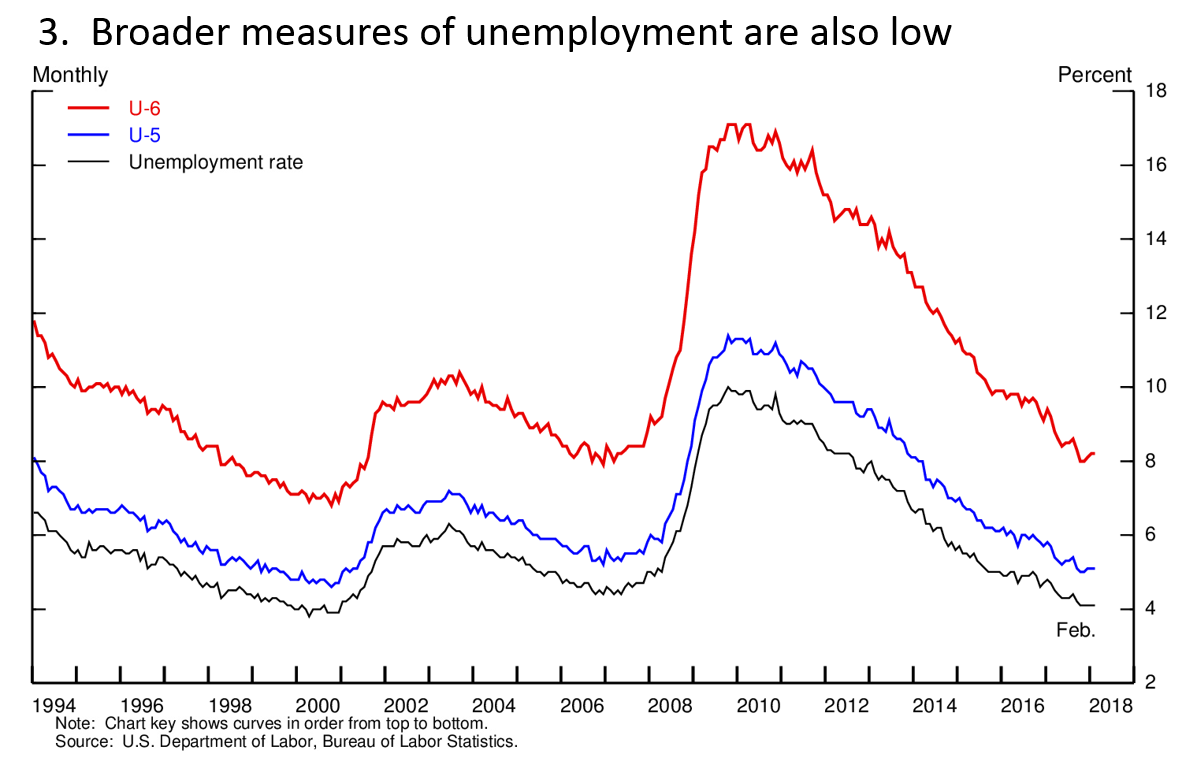
上圖是失業率和兩個更寬泛地衡量失業率的指標,我們通常稱為U5和U6。U5包括失業的與過去1年中都在找工作的。U6包括U5和那些正在做兼職且在找全職工作的。U5和U6近些年都顯著下降,他們現在處於金融危機之前的水平,盡管尚未回到1999年-2000年的低位。
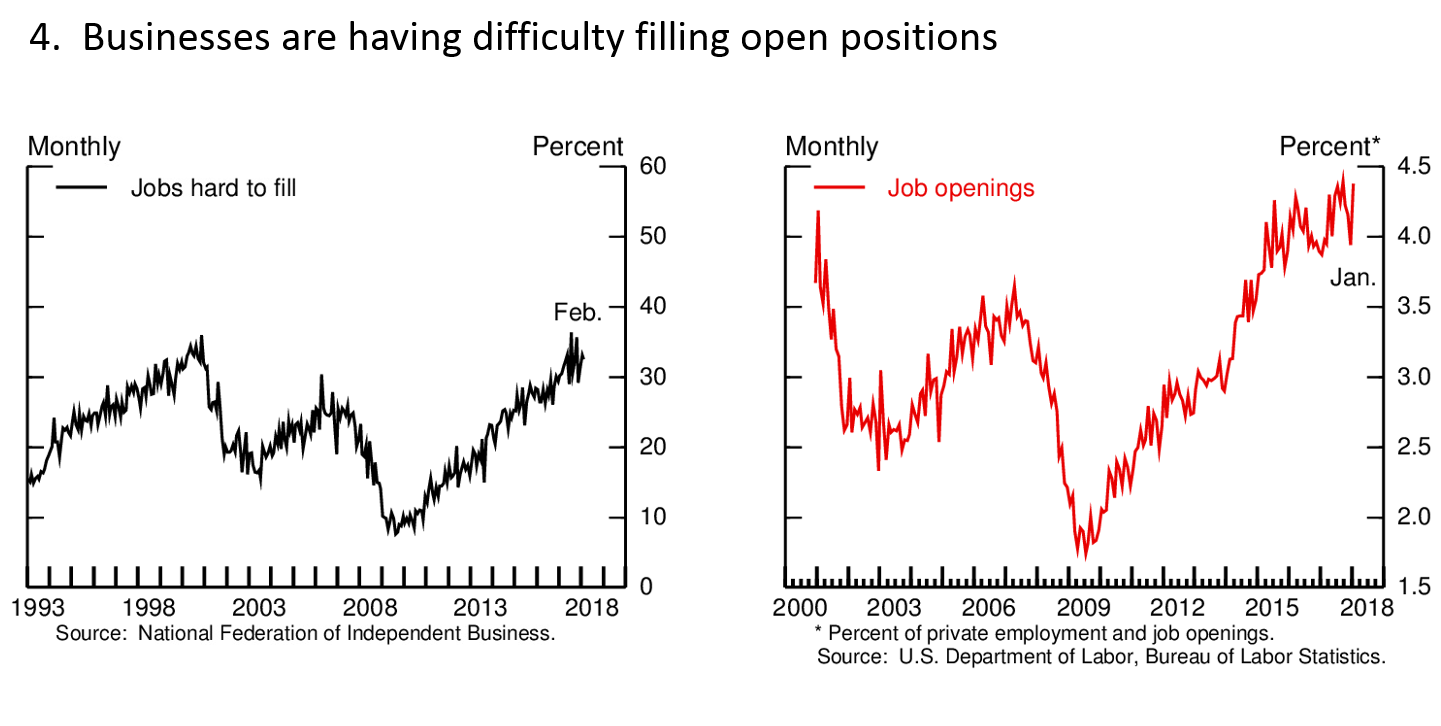
這個圖表是20年前雇主雇傭到符合條件的員工的難度,空餘崗位率達到曆史峰值,也是過去數周的平均水平。家庭反應出工作機會也大幅上升,這與工商企業反應的工作機會一致。此外,員工離職的比率也很高,意味著員工也足夠有信心自願離開現在的工作崗位。
目前來看我們的勞動力市場偏緊,但是其他的數據卻並沒有那麽明朗。勞動參與率,即測量勞動力年齡人口是否在工作或是找工作的指標過去4年較為平穩,沒有太大變化。不過由於老齡化人口上升,抑製了勞動參與率,這個數值平穩也是一個好的信號。不過,25-54歲年齡間的勞動參與率也仍未回複至危機前的水平,這意味著有更多的人本應回到勞動力市場。但是同時,強勁的勞動力市場也在將那些離職很久的人拉了回來。例如,有些過去未就業的成年人回到勞動力市場的比例在過去這些年有所上升。
薪資也保持了溫和增長,低生產率是近些年薪資未能顯著增長的重要原因。同時,這也意味著勞動力市場還不夠緊。我也將進一步關注隨著勞動力市場持續增強,薪資的增長狀況。
據上述數據與指標來看,我們可以說勞動力市場已經達到我們最大就業的目標了嗎?由於長期很多指標是不確定的,但是也已經表明很接近最大就業。一些其他的指標仍不夠樂觀。最大就業的評估是不夠確定的,但也得到了修正。委員會將持續關注所有這些指標,以期將勞動力資源得到最大程度的利用。
通脹
勞動力市場雖然得到了根本改善,通脹值卻很低,持續低於2%的長期目標。截至2月,消費者價格過去12個月增長了1.8%。核心價格指數(排除了能源和食品的價格)在同一時期裏上漲了1.6%。實際上,這些指數在過去6年中都低於2%。通脹持續低於我們的目標導致了一個,即通脹和失業率之間的關係——菲利普斯曲線。既然失業率如此低,為何還看不到更高的通脹?
你們仔細閱讀FOMC的會議紀要便可發現,關於通脹變動的討論貫穿了我們整個1月的會議。幾乎所有的成員都認為菲利普斯曲線仍是有效的,但是他們也承認勞動力市場與通脹之間的聯係變弱了,也更難預估,反應出美國和其他發達經濟體很可能會經曆更長時間的低通脹。成員們還發現,通脹預期與能源、進口價格的變動可以影響通脹。
我的觀點是這些數據一直呈現出整個國家勞動力市場和通脹的變化。這一聯係在過去幾十年中雖然變弱,但是也仍持續著,我認為它們也將持續影響貨幣政策。通脹低迷在前些年可以用高失業率來解釋,2015年和2016年則是因為能源價格下跌、美元上漲。可是去年通脹的下降確實一個意外。2017年低於2%的目標反映出,或者至少部分反映出一些反常的價格下跌,例如手機。實際上月度通脹值在過去7個月已經變得更為強勁了,過去12個月的通脹指數也在這個春天有所上升。我一貫堅持我的觀點,FOMC成員3月的預測中位數顯示今年通脹將上漲至1.9%,2019年將上漲至2%。
長期挑戰
雖然新增就業強勁,失業率很低,美國經濟卻麵臨一些長期的挑戰。在這一次經濟擴張中,GDP年平均增速剛剛超過2%,遠低於此前的擴張。雖然這幾個季度的增速更快,但與危機之前相比也還是很低。可是,失業率在這一次擴張中下跌了6個百分點,這也意味著這一次增長扭轉了勞動力市場的局麵。FOMC對經濟增長的預測中位數為1.8%。來自Blue-Chip私人預測機構的這個數值為2%左右。
這個問題進一步展開來看,我們來看看勞動率增長的情況。與2001-2007年的那一次增長做一個對比。那一次擴張中,經濟增長年均增速接近3%。除了增速更快,年均新增就業卻比這一次低0.5%。兩者的不同正是生存率的不同,21世紀初期的生產率增速幾乎是這一輪擴張的2倍。
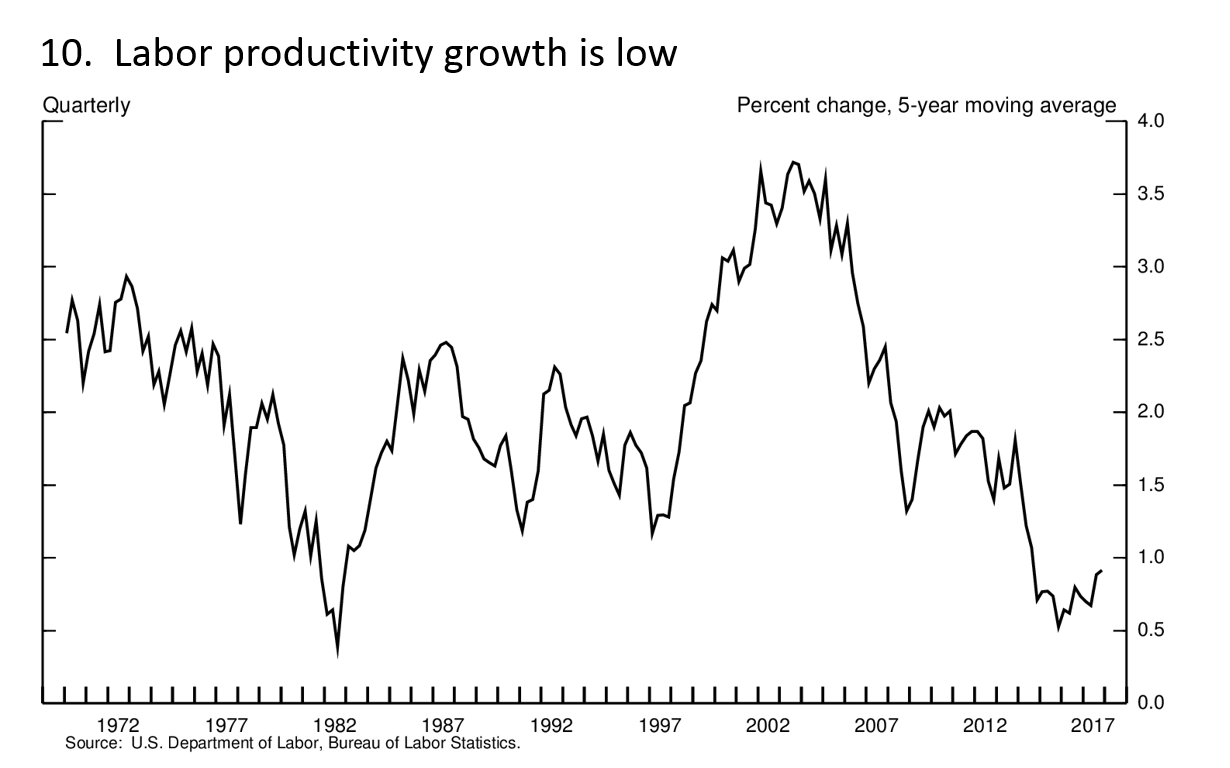
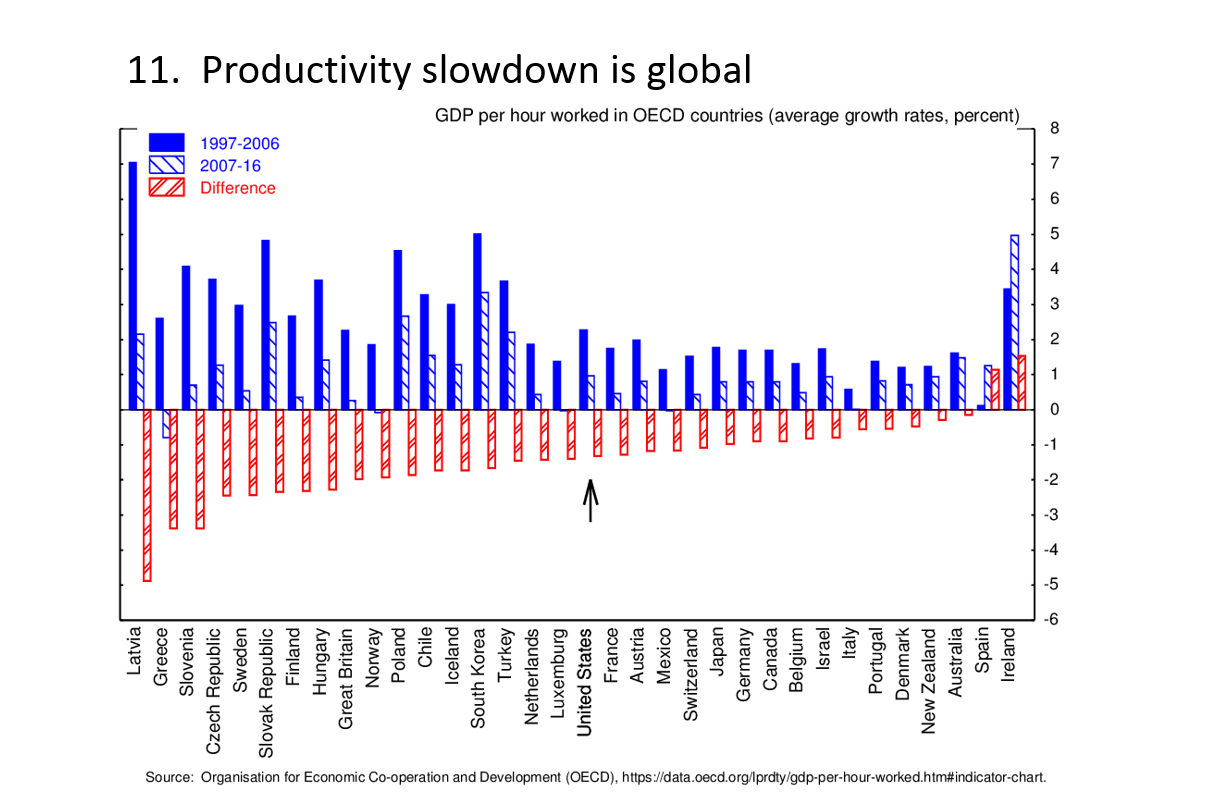
長遠來看,勞動生產率增速自2010年以來便維持在二戰後的最低水平,僅為戰後的四分之一的水平。而且這似乎成為一個全球的現象,即便是那些沒怎麽受金融危機影響的國家也是如此。這一現象表明這不僅僅是美國的問題。
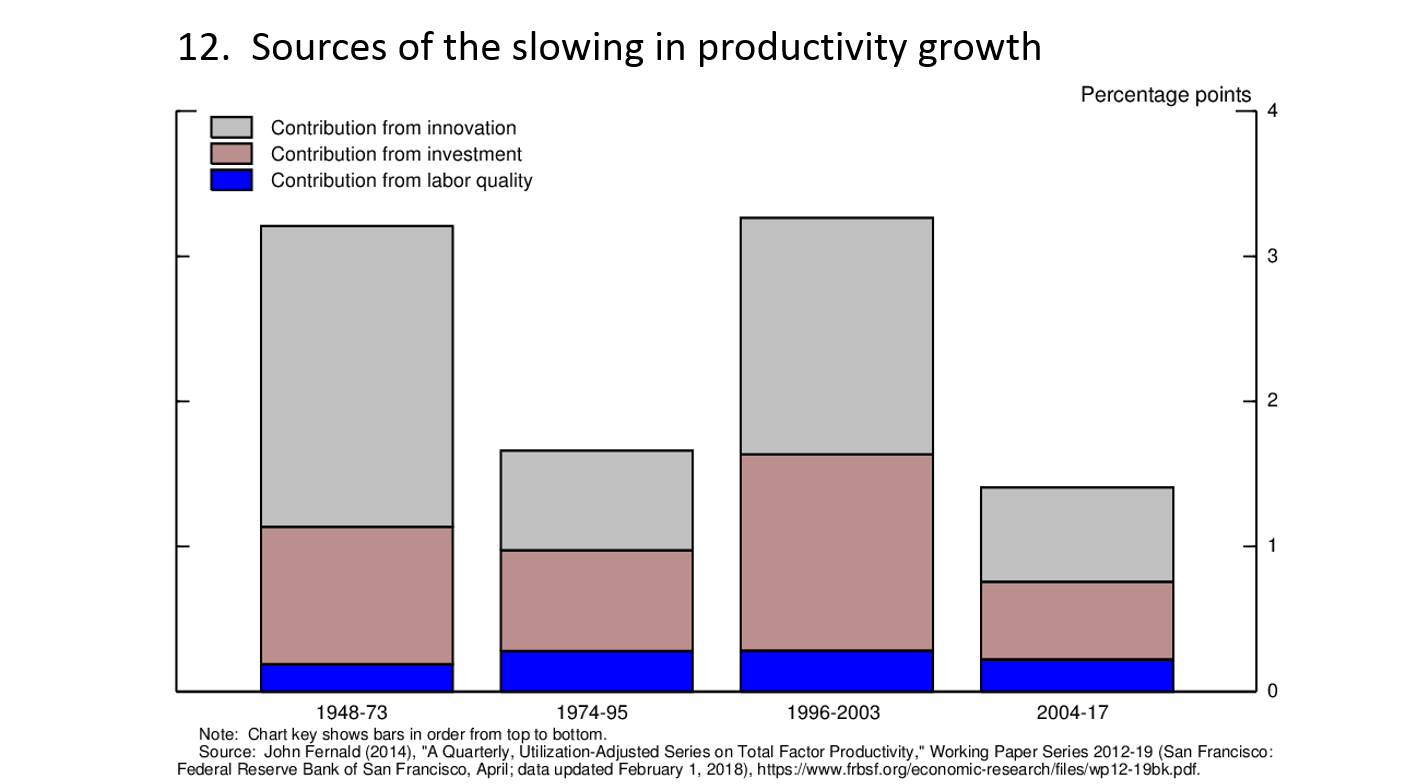
勞動生產率增速受製於商業投資、勞動力的工作經驗與技能、科技變革、效率提升(經常附著於其他因素上)等因素。在美國與很多其他國家,勞動生產率下降是因為危機後投資疲軟。但是近期投資有所回暖,也表明資本集約度會回升。另一個導致下降的原因是總體生產力增速的下降,其前景也是相當不確定的。整體生產力增速是很難預測的,對此有很多不同的觀點。一些人為生產力受製於信息技術革命,現在的科技變革對刺激生產力卻幫助不大。有些人則持商業動能論,認為有些員工辭職,去尋找新的工作,導致資本和勞動力向生產力更高的領域移動變緩,從而導致生產力增速下降。
機器人、生物科技和人工智能等新科技領域的突破帶來了一些樂觀的觀點。他們認為根本的生產力增長在於能源生產和電商領域的創新,樂觀主義者們指出科技的進步經常需要數十年的時間才會在經濟中反應出來,對生產力的影響也是如此。從蒸汽機和電力的運用中都可以看到這一遲滯,這兩項創新最終都帶來了生產力的大幅提升。按照這個觀點,我們隻需對新科技保持耐心。隻有時間可以告訴我們哪個觀點更好,我們也沒法依此就預測接下來生產力就會增長。
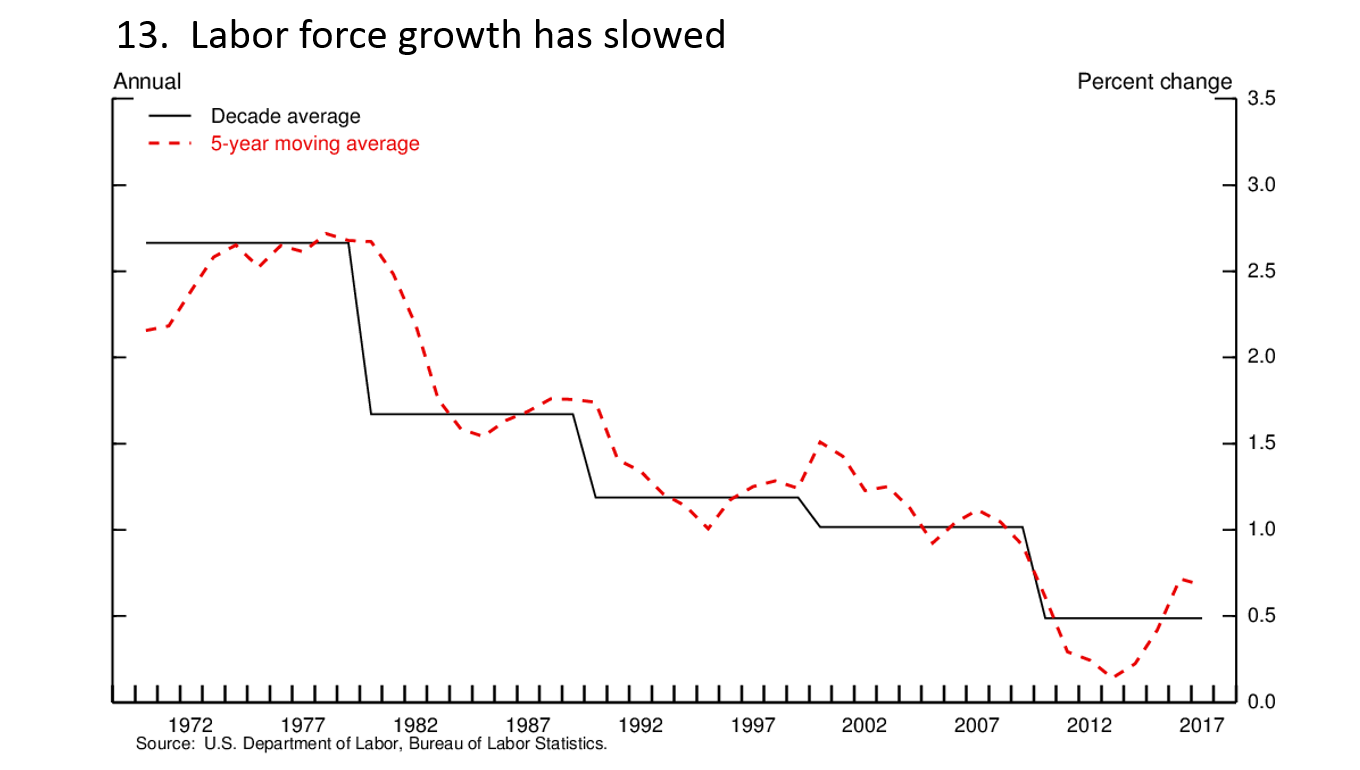
另一個有助於產出增長的重要指標是工作時長。2010年以來這個數值已經年均增長0.5%,低於10年前的數值。有可能是因為嬰兒潮出生的人群逐漸成為老齡人群,這一趨勢也仍將持續。另一個原因是25-54歲人群的勞動生產率從2010年-2015年後持續下降,現在仍處於低位。這個數值幾乎下降了超過50年,其間女性的參與率自20世紀90年代有所提升,而後又轉為下降,也已下降了20年左右。
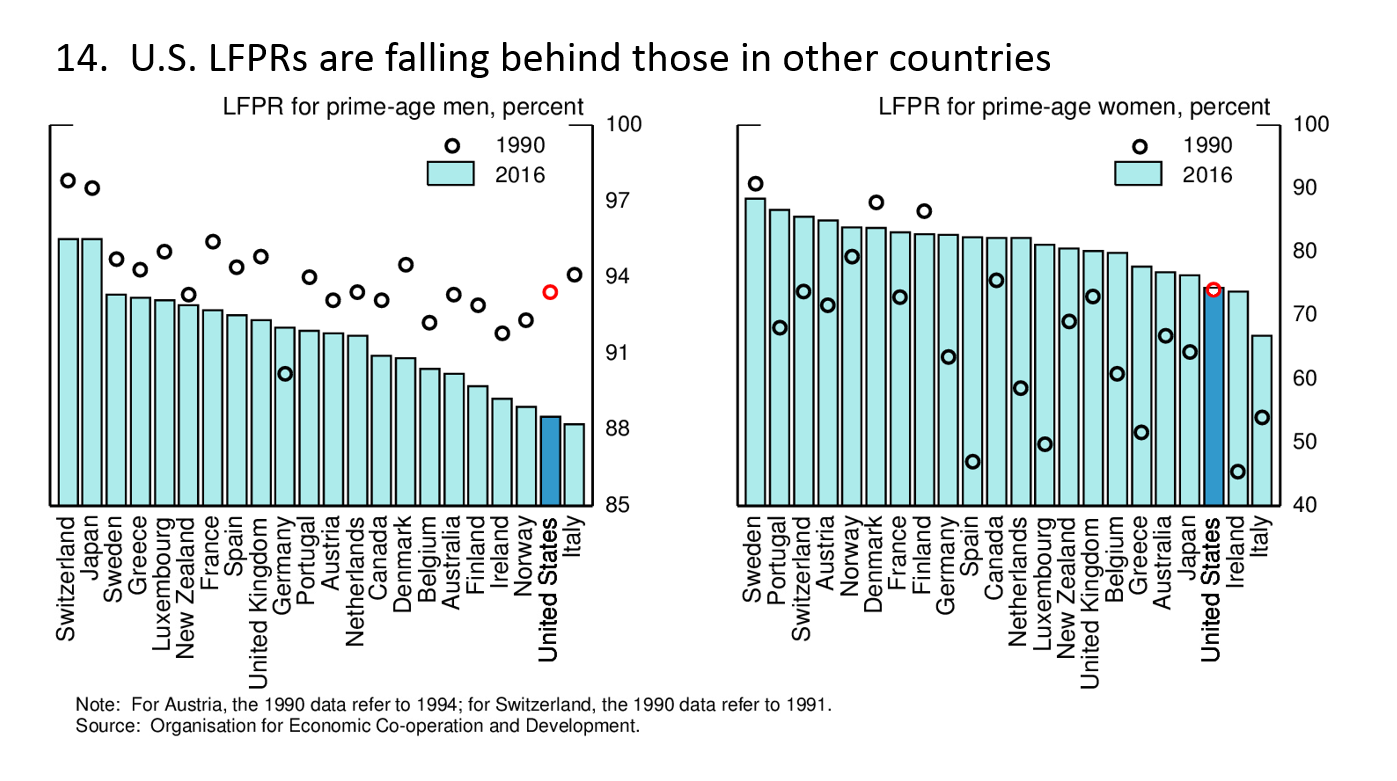
這一趨勢在美國比在其他發達經濟體要更為嚴重。20世紀90年代,與其他國家相比,美國的女性勞動參與率相當高。但是現在這一數值上,美國僅高於意大利,低於德國、法國和西班牙。
黃金年齡勞動參與率下降的原因目前沒有共識。雖然全球化和自動化會影響國內的生產率和增長,導致沒有大學學位和製造業工人失業。但是除此之外,近幾十年來殘障人士人數增加,阿片樣物質(成癮性藥物)泛濫有可能導致黃金年齡雇員數下降。由於美國的這個數值比其他國家都大,應該是有一些美國獨有的原因起到了主要作用。正如我前麵說的,一個強勁的經濟體可能持續將這個年齡段的人群帶回勞動力市場,也可以減少離開勞動力市場的人數。研究表明結構性措施是有利於提升這個年齡群體的勞動力參與率的,例如提升教育水平,反對濫用成癮性藥物等。
總而言之,這些影響長期增長的因素仍在持續,尤其是勞動力市場增長緩慢。其他的數值則很難預測,例如生產力。我們可以采取措施提升勞動參與率,並且保持生產率的持續增長。美聯儲並沒有做到這一點的政策工具,包括提升教育和工作技能方麵的投資、工商業投資與基礎設施投資等等。
貨幣政策
金融危機之後,FOMC在提升就業,防止通脹下降方麵做出了努力。隨著經濟持續複蘇,減少貨幣政策的支持也是合適的。如果等到通脹和就業達到我們的目標之後再收緊,有可能使通脹過熱。基於這個理由,貨幣政策如果突然收緊,有可能刺激到經濟,甚至引發衰退。
所以,為了支撐經濟持續擴張FOMC采取漸進路徑減少貨幣政策的支持。我們2015年12月開始加息,從那以來,經濟持續擴張,但是通脹仍然很低迷,委員會也持續在加息。委員會保持耐心,也會減少無法預期的情況的風險,防止經濟再度衰退到需要聯邦基金利率再次回到零(雖然它仍是有效的),因此我們將主動縮緊寬鬆的貨幣政策。
再次,去年10月FOMC開始漸進地縮減資產負債表,減少我們的債券持有也是將貨幣政策保持中性的另一種方式。縮表的緊張穩步展開,有望進一步緊縮金融環境。在接下來的幾年中,我們的資產負債表將顯著縮減。
我們上個月的會議上,FOMC投票決定將聯邦基金利率提升至了1.50%-1.75%。這也是表明我們緊縮政策的有一舉動。FOMC的漸進緊縮路徑有助於經濟體更為強勁。
接下來的幾年間,我們將持續以2%為通脹目標,以及維持強勁的勞動力市場以支撐經濟擴張。正如我說的,我與我的FOMC同事認為,經濟會持續強勁,漸進加息是達到這些目標的最佳路徑。如果加息太慢,則有可能麵臨需要突然緊縮的窘境,這對經濟擴張是有害的。而加息太快也會導致通脹長期低於2%的目標。我們的漸進加息策略正在於平衡這兩個風險。
當然,我們對於合適的貨幣政策的觀點在接下來的幾個月甚至幾年間都將根據經濟數據和展望而調整。我們主要目標仍會不變:增加更多的就業和穩定通脹水平。
作者:澎湃新聞 蔣夢瑩
April 06, 2018
The Outlook for the U.S. Economy
Chairman Jerome H. Powell
At The Economic Club of Chicago, Chicago, Illinois

Jerome H. Powell, the Federal Reserve chairman, addressing the Economic Club of Chicago on Friday. He emphasized the economy’s strength, touching on the looming threat of a trade war only in a question-and-answer session. Lyndon French for The New York Times
For more than 90 years, the Economic Club of Chicago has provided a valued forum for current and future leaders to discuss issues of vital interest to this city and our nation. I am honored to have the opportunity to speak to you here today.
At the Federal Reserve, we seek to foster a strong economy for the benefit of individuals, families, and businesses throughout our country. In pursuit of that overarching objective, the Congress has assigned us the goals of achieving maximum employment and stable prices, known as the dual mandate. Today I will review recent economic developments, focusing on the labor market and inflation, and then touch briefly on longer-term growth prospects. I will finish with a discussion of monetary policy.
Recent Developments and the State of the Economy
After what at times has been a slow recovery from the financial crisis and the Great Recession, growth has picked up. Unemployment has fallen from 10 percent at its peak in October 2009 to 4.1 percent, the lowest level in nearly two decades (figure 1). Seventeen million jobs have been created in this expansion, and the monthly pace of job growth remains more than sufficient to employ new entrants to the labor force (figure 2). The labor market has been strong, and my colleagues and I on the Federal Open Market Committee (FOMC) expect it to remain strong. Inflation has continued to run below the FOMC's 2 percent objective but we expect it to move up in coming months and to stabilize around 2 percent over the medium term.
Beyond the labor market, there are other signs of economic strength. Steady income gains, rising household wealth, and elevated consumer confidence continue to support consumer spending, which accounts for about two thirds of economic output. Business investment improved markedly last year following two subpar years, and both business surveys and profit expectations point to further gains ahead. Fiscal stimulus and continued accommodative financial conditions are supporting both household spending and business investment, while strong global growth has boosted U.S. exports.
As many of you know, each quarter FOMC participants--the members of the Board of Governors and the presidents of the Reserve Banks--submit their individual projections for growth, unemployment, and inflation, as well as their forecasts of the appropriate path of the federal funds rate, which the Committee uses as the primary tool of monetary policy. These individual projections are compiled and published in the Summary of Economic Projections, or SEP. FOMC participants submitted their most recent forecasts three weeks ago, and those forecasts show a strengthening in the medium-term economic outlook (table 1). As you can see, participants generally raised their forecasts for growth in inflation-adjusted gross domestic product (GDP) and lowered their forecasts for unemployment. In addition, many participants expressed increased confidence that inflation would move up toward our 2 percent target. The FOMC sees the risks to the economic outlook as roughly balanced.
The State of the Labor Market
As I mentioned, the headline unemployment rate has declined to levels not seen since 2000. The median projection in the March SEP calls for unemployment to fall well below 4 percent for a sustained period, something that has not happened since the late 1960s. This strong labor market forecast has important implications for the fulfillment of both sides of the dual mandate, and thus for the path of monetary policy. So I will spend a few minutes exploring the state of the job market in some detail.
A good place to begin is with the term "maximum employment," which the Committee takes to mean the highest utilization of labor resources that is sustainable over time. In the long run, the level of maximum employment is not determined by monetary policy, but rather by factors affecting the structure and dynamics of the labor market.1 Also, the level of maximum employment is not directly measureable, and it changes over time. Real-time estimates of maximum employment are highly uncertain.2 Recognizing this uncertainty, the FOMC does not set a fixed goal for maximum employment. Instead, we look at a wide range of indicators to assess how close the economy is to maximum employment.
The headline unemployment rate is arguably the best single indicator of labor market conditions. In addition, it is widely known and updated each month. As I noted, the unemployment rate is currently at 4.1 percent, which is a bit below the FOMC's median estimate of the longer-run normal rate of unemployment. However, the unemployment rate does not paint a complete picture. For example, to be counted in the official measure as unemployed, a person must have actively looked for a job in the past four weeks.3 People who have not looked for work as recently are counted not as unemployed, but as out of the labor force, even though some of them actually want a job and are available to work. Others working part time may want a full-time job. And still others who say that they do not want a job right now might be pulled into the job market if the right opportunity came along. So, in judging tightness in the labor market, we also look at a range of other statistics, including alternative measures of unemployment, as well as measures of vacancies and job flows, surveys of households' and businesses' perceptions of the job market, and, of course, data on wages and prices.
Figure 3 shows the headline unemployment rate and two broader measures of unemployment, known as U-5 and U-6.4 U-5 includes the unemployed plus people who say they want a job and have looked for one in the past year (though not in the past four weeks). U-6 includes all those counted in U-5 plus people who are working part time but would like full-time work. Like the headline unemployment rate, both U-5 and U-6 have declined significantly in recent years. They are now at levels seen before the financial crisis, though not quite as low as they were in 1999 to 2000, a period of very tight job market conditions.
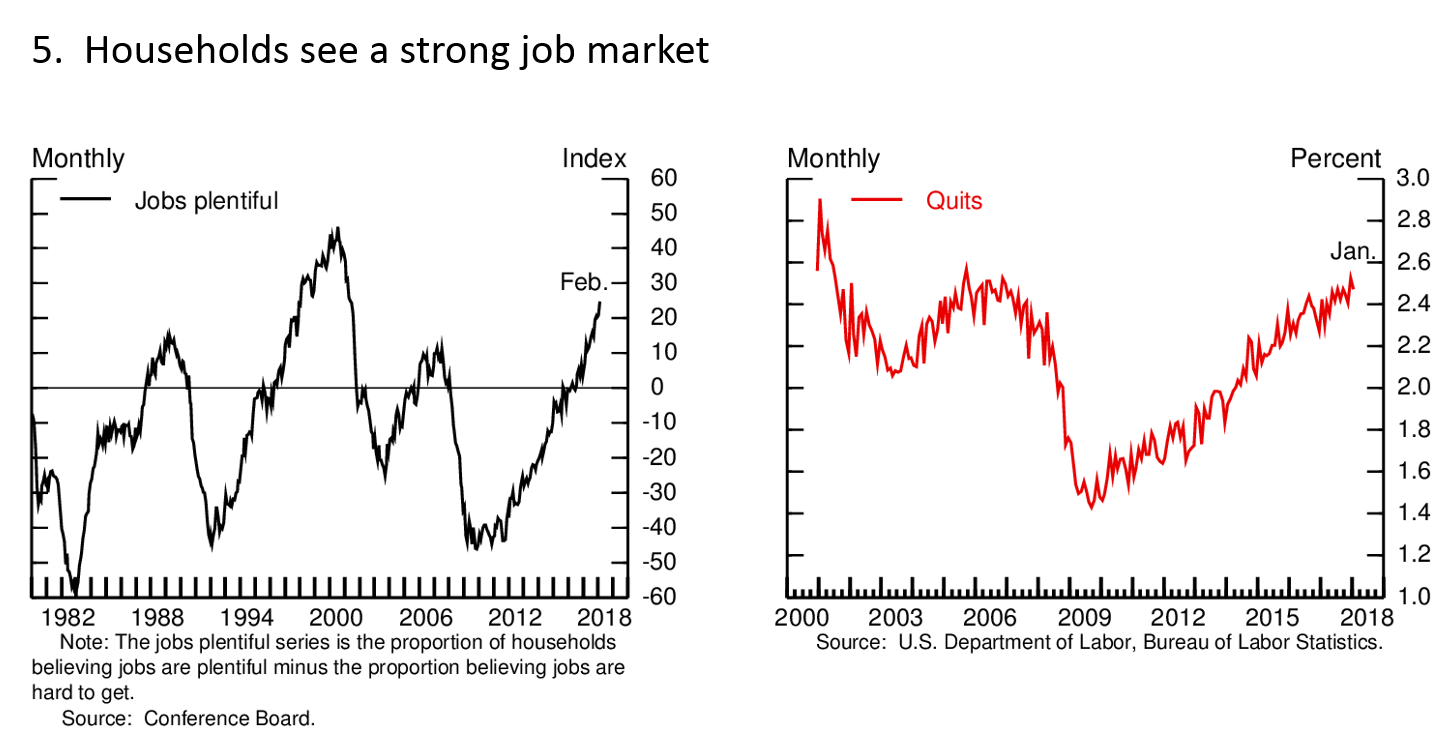
The left panel of the next chart shows that employers are having about as much difficulty now attracting qualified workers as they did 20 years ago (figure 4). Likewise, the job vacancy rate, shown on the right, is close to its all-time high, as is the average number of weeks it takes to fill a job opening.5 Households also are increasingly reporting that jobs are plentiful (figure 5), which is consistent with the high level of job postings reported by firms. In addition, the proportion of workers quitting their jobs is high, suggesting that workers are being hired away from their current employers and that others are confident enough about their prospects to leave jobs voluntarily--even before they have landed their next job.
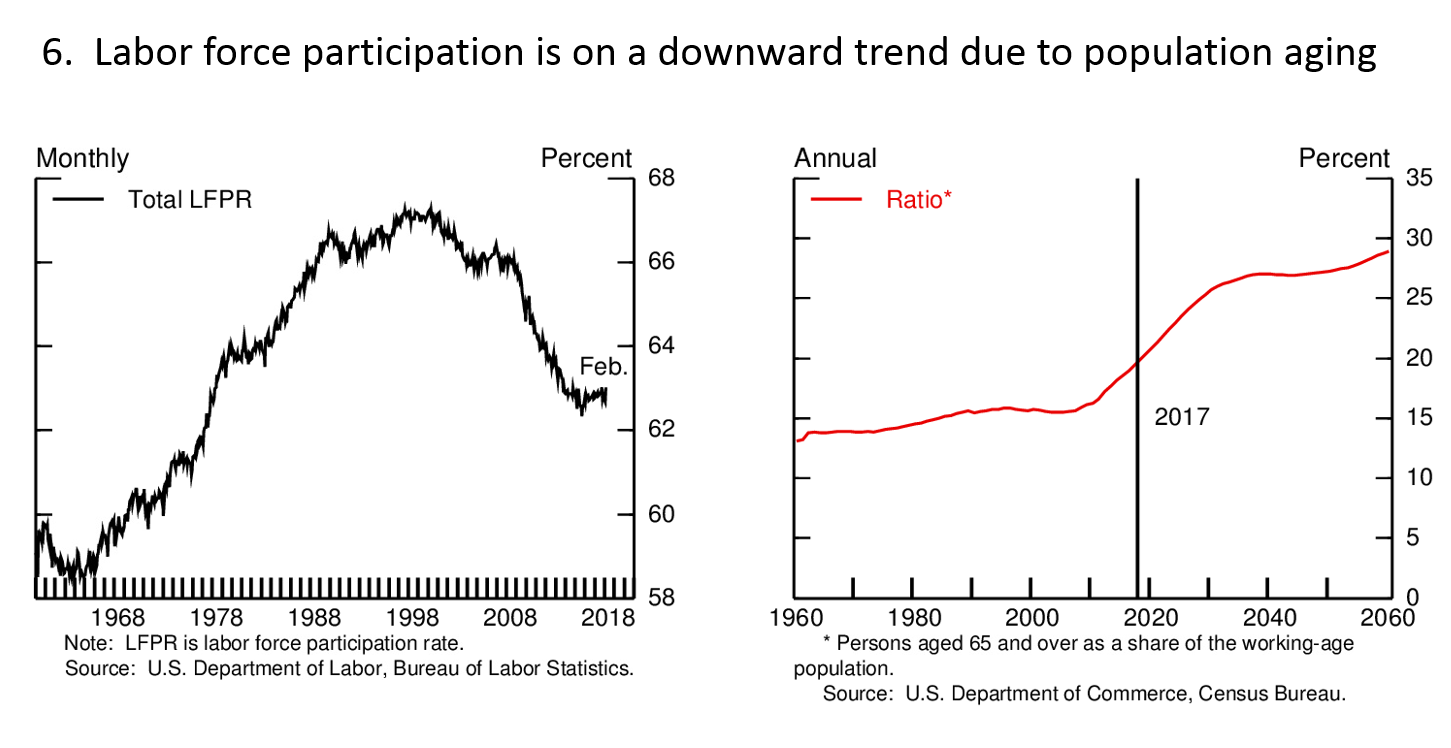
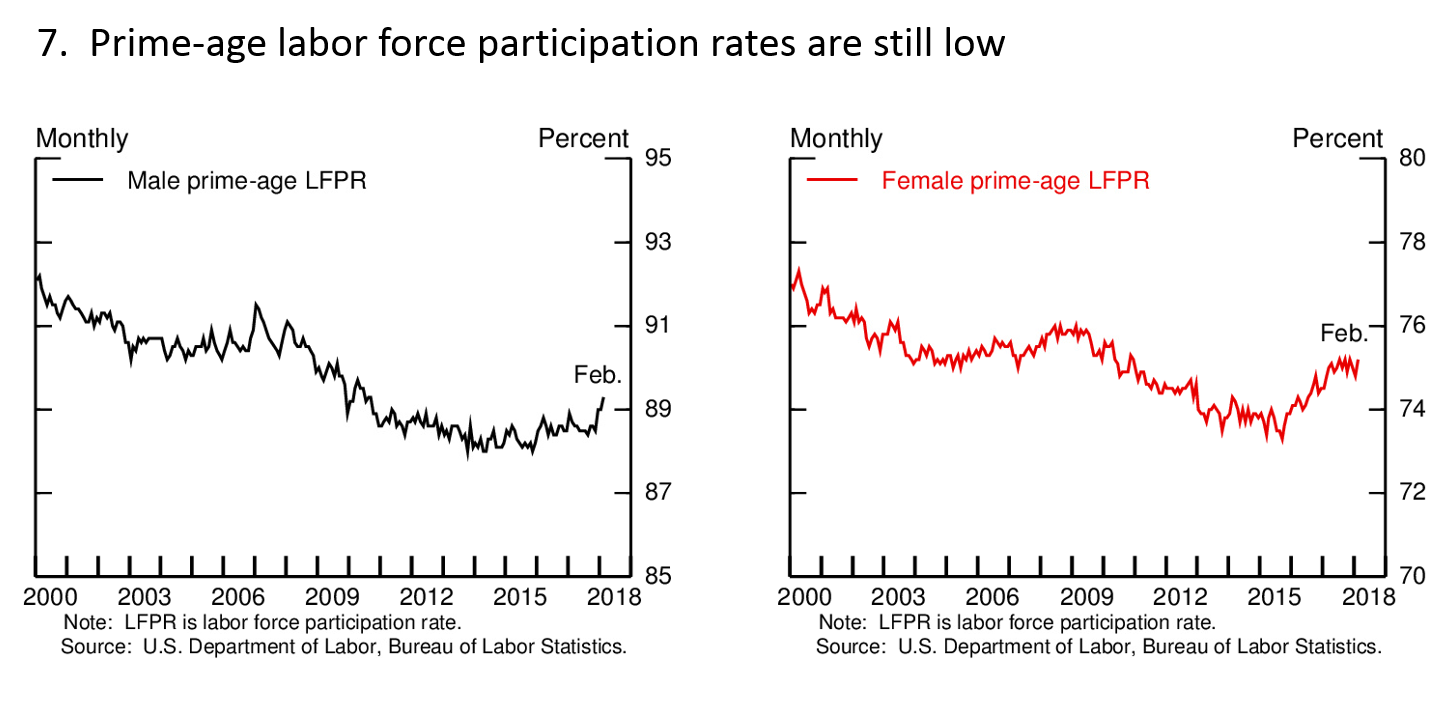
While the data I have discussed thus far do point to a tight labor market, other data are less definitive. The labor force participation rate, which measures the percentage of working age individuals who are either working or actively looking for a job, has remained steady for about four years (figure 6). This flat performance is actually a sign of improvement, since increased retirements as our population ages have been putting downward pressure on participation and will continue to do so. However, the participation rate of prime-age workers (those between the ages of 25 and 54) has not recovered fully to its pre-recession level, suggesting that there might still be room to pull more people into the labor force (figure 7). Indeed, the strong job market does appear to be drawing back some people who have been out of the labor force for a significant time. For example, the percentage of adults returning to the labor force after previously reporting that they were not working because of a disability has increased over the past couple of years, and anecdotal reports indicate that employers are increasingly willing to take on and train workers they would not have considered in the past.6
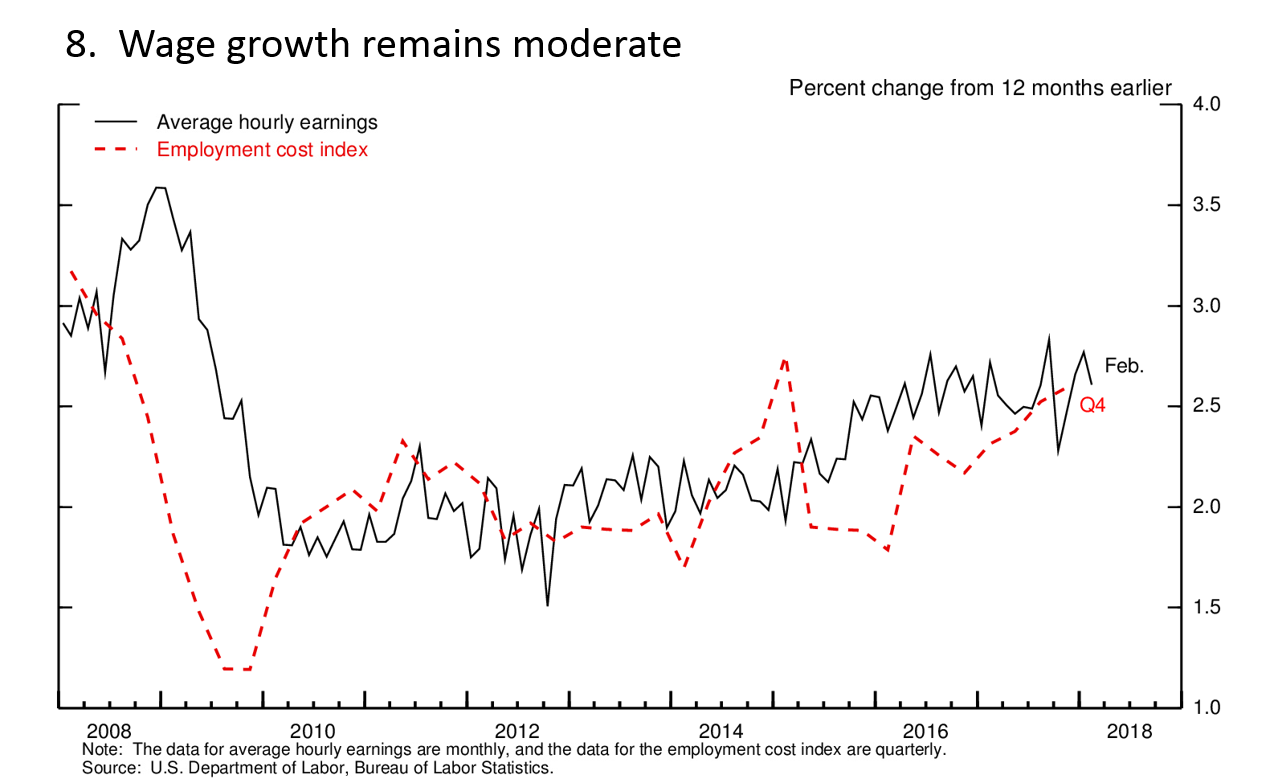
Wage growth has also remained moderate, though it has picked up compared with its pace in the early part of this recovery (figure 8). Weak productivity growth is an important reason why we have not seen larger wage gains in recent years. At the same time, the absence of a sharper acceleration in wages suggests that the labor market is not excessively tight. I will be looking for an additional pickup in wage growth as the labor market strengthens further.
Taking all of these measures of labor utilization on board, what can we say about the state of the labor market relative to our statutory goal of maximum employment? While uncertainty around the long run level of these indicators is substantial, many of them suggest a labor market that is in the neighborhood of maximum employment. A few other measures continue to suggest some remaining slack. Assessments of the maximum level of employment are uncertain, however, and subject to revision. As we seek the highest sustainable utilization of labor resources, the Committee will be guided by incoming data across all of these measures.
Inflation
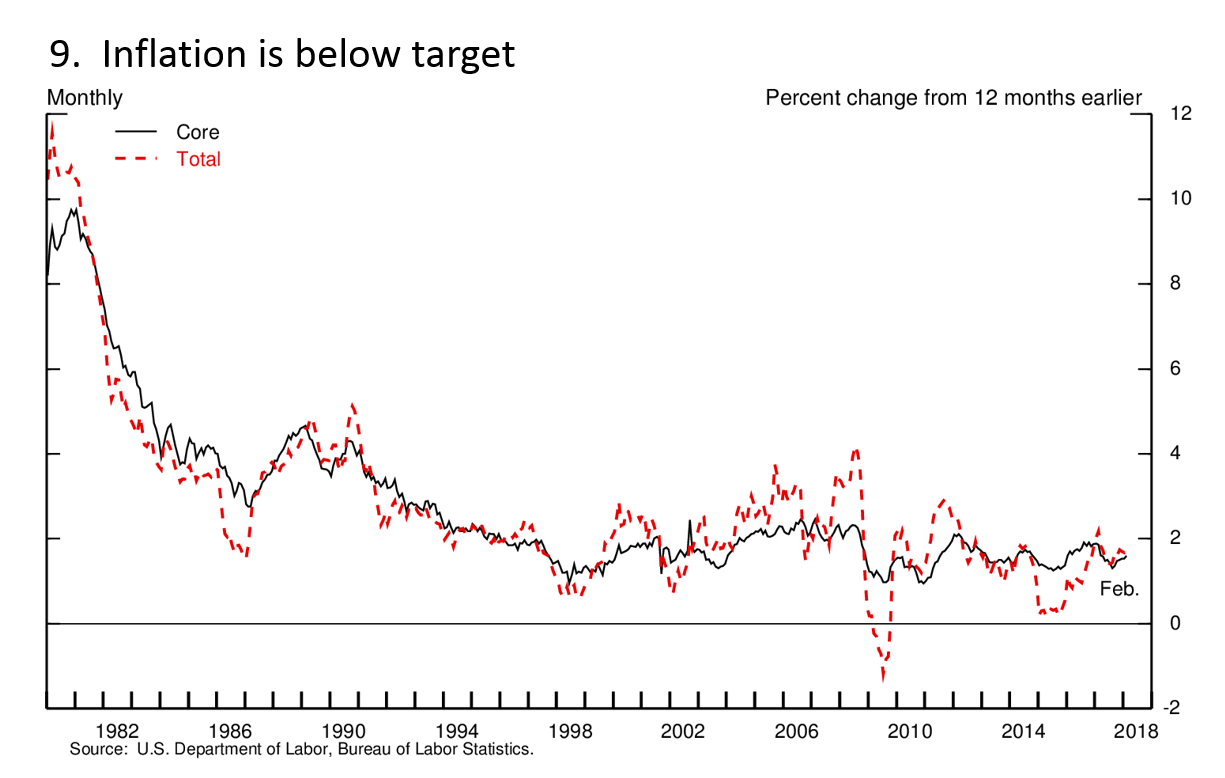
That brings me to inflation--the other leg of our dual mandate. The substantial improvement in the labor market has been accompanied by low inflation. Indeed, inflation has continued to run below our 2 percent longer-run objective (figure 9). Consumer prices, as measured by the price index for personal consumption expenditures, increased 1.8 percent over the 12 months ending in February. The core price index, which excludes the prices of energy and food and is typically a better indicator of future inflation, rose 1.6 percent over the same period. In fact, both of these indexes have been below 2 percent consistently for the past half-dozen years. This persistent shortfall in inflation from our target has led some to question the traditional relationship between inflation and the unemployment rate, also known as the Phillips curve. Given how low the unemployment rate is, why aren't we seeing higher inflation now?
As those of you who carefully read the minutes of each FOMC meeting are aware--and I know there are some of you out there--we had a thorough discussion of inflation dynamics at our January meeting. Almost all of the participants in that discussion thought that the Phillips curve remained a useful basis for understanding inflation. They also acknowledged, however, that the link between labor market tightness and changes in inflation has become weaker and more difficult to estimate, reflecting in part the extended period of low and stable inflation in the United States and in other advanced economies. Participants also noted that other factors, including inflation expectations and transitory changes in energy and import prices, can affect inflation.
My view is that the data continue to show a relationship between the overall state of the labor market and the change in inflation over time. That connection has weakened over the past couple of decades, but it still persists, and I believe it continues to be meaningful for monetary policy. Much of the shortfall in inflation in recent years is well explained by high unemployment during the early years of the recovery and by falling energy prices and the rise in the dollar in 2015 and 2016. But the decline in inflation last year, as labor market conditions improved significantly, was a bit of a surprise. The 2017 shortfall from our 2 percent goal appears to reflect, at least partly, some unusual price declines, such as for mobile phone plans, that occurred nearly a year ago. In fact, monthly inflation readings have been firmer over the past several months, and the 12-month change should move up notably this spring as last spring's soft readings drop out of the 12-month calculation. Consistent with this view, the median of FOMC participants' projections in our March survey shows inflation moving up to 1.9 percent this year and to 2 percent in 2019.
Longer-Run Challenges
Although job creation is strong and unemployment is low, the U.S. economy continues to face some important longer-run challenges. GDP growth has averaged just over 2 percent per year in the current economic expansion, much slower than in previous expansions. Even the higher growth seen in recent quarters remains below the trend before the crisis. Nonetheless, the unemployment rate has come down 6 percentage points during the current expansion, suggesting that the trend growth necessary to keep the unemployment rate unchanged has shifted down materially. The median of FOMC participants' projections of this longer-run trend growth rate is 1.8 percent. The latest estimate from the Blue-Chip consensus of private forecasters is about 2 percent.7
To unpack this discussion a little further, we can think of output growth as composed of increases in hours worked and in output per hour, also known as productivity growth. Here, a comparison with the 2001-to-2007 expansion is informative. Output growth in that earlier expansion averaged nearly 3 percent per year, well above the pace in the current expansion. Despite the faster output growth, however, average job growth in the early 2000s was 1/2 percentage point per year weaker than in the current expansion. The difference, of course, is productivity, which grew at more than twice the pace in the early 2000s than it has in recent years.
Taking a longer view, the average pace of labor productivity growth since 2010 is the slowest since World War II and about one-fourth of the average postwar rate (figure 10). Moreover, the productivity growth slowdown seems to be global and is evident even in countries that were little affected by the financial crisis (figure 11). This observation suggests that factors specific to the United States are probably not the main drivers.
As shown in figure 12, labor productivity growth can be broken down into the contributions from business investment (or capital deepening), changes in the skills and work experience of the workforce, and a residual component that is attributed to other factors such as technological change and efficiency gains (usually lumped together under the term total factor or multifactor productivity).
In the United States and in many other countries, some of the slowdown in labor productivity growth can be traced to weak investment after the crisis. Investment has picked up recently in the United States, however, which suggests that capital deepening may pick up as well. The other big contributor to the slowdown has been in total factor productivity growth. The outlook for this dimension of productivity is considerably more uncertain. Total factor productivity growth is notoriously difficult to predict, and there are sharply different views on where it might be heading. Some argue that the productivity gains from the information technology revolution are largely behind us, and that more-recent technological innovations have less potential to boost productivity.8 Others argue that a well-documented decline in measures of business dynamism--such as the number of start-ups, the closure of less-productive businesses, and the rates at which workers quit their jobs and move around the country to take a new job--has held back productivity growth, in part by slowing the movement of capital and labor toward their most productive uses.9
New technological breakthroughs in many areas--robotics, biotech, and artificial intelligence to name just a few--have led others to take a more optimistic view.10 They point to substantial productivity gains from innovation in areas such as energy production and e-commerce. In addition, the optimists point out that advances in technology often take decades to work their way into the economy before their ultimate effects on productivity are felt. That delay has been observed even for game-changing innovations like the steam engine and electrification, which ultimately produced broad increases in productivity and living standards. In this view, we just need to be patient for new technologies to diffuse through the economy. Only time will tell who has the better view??the record provides little basis to believe that we can accurately forecast the rate of increase in productivity.
The other principal contributor to output growth is hours worked. Hours growth, in turn, is largely determined by growth in the labor force, which has averaged just 1/2 percent per year since 2010, well below the average in previous decades (figure 13). One reason for slower growth of the labor force is that baby boomers are aging and retiring, and that trend will continue. But another reason is that labor force participation of people between the ages of 25 and 54--prime-age individuals--declined from 2010 to 2015 and remains low. Indeed, the participation rate for prime-age men has been falling for more than 50 years, while women's participation in this age group rose through the 1990s but then turned downward, and it has fallen for the past 20 years.
These trends in participation have been more pronounced in the United States than in other advanced economies. In 1990, the United States had relatively high participation rates for prime-age women relative to other countries and was in the midrange of advanced economies for prime-age men. However, we now stand at the low end of participation for both men and women in this age group--just above Italy, but well below Germany, France, and Spain (figure 14).
There is no consensus about the reasons for the long-term decline in prime-age participation rates, and a variety of factors could have played a role.11 For example, while automation and globalization have contributed positively to overall domestic production and growth, adjustment to these developments has resulted in dislocations of many workers without college degrees and those employed in manufacturing. In addition, factors such as the increase in disability rolls in recent decades and the opioid crisis may have reduced the supply of prime-age workers. Given that the declines have been larger here than in other countries, it seems likely that factors specific to the United States have played an important role. As I noted earlier, the strong economy may continue to pull some prime-age individuals back into the labor force and encourage others not to drop out. Research suggests that structurally-oriented measures--for example, improving education or fighting the opioid crisis--also will help raise labor force participation in this age group.12
To summarize this discussion, some of the factors weighing on longer-term growth are likely to be persistent, particularly the slowing in growth of the workforce. Others are hard to predict, such as productivity. But as a nation, we are not bystanders. We can put policies in place that will support labor force participation and give us the best chance to achieve broad and sustained increases in productivity, and thus in living standards. These policies are mostly outside the toolkit of the Federal Reserve, such as those that support investment in education and workers' skills, business investment and research and development, and investment in infrastructure.
Monetary Policy
Let me turn now to monetary policy. In the aftermath of the financial crisis, the FOMC went to extraordinary lengths to promote the recovery, support job growth, and prevent inflation from falling too low. As the recovery advanced, it became appropriate to begin reducing monetary policy support. Since monetary policy affects the economy with a lag, waiting until inflation and employment hit our goals before reducing policy support could have led to a rise in inflation to unwelcome levels. In such circumstances, monetary policy might need to tighten abruptly, which could disrupt the economy or even trigger a recession.
As a result, to sustain the expansion, the FOMC adopted a gradual approach to reducing monetary policy support. We began in December 2015 by raising our target for the federal funds rate for the first time in nearly a decade. Since then, with the economy improving but inflation still below target and some slack remaining, the Committee has continued to gradually raise interest rates. This patient approach also reduced the risk that an unforeseen blow to the economy might push the federal funds rate back near zero??its effective lower bound--thus limiting our ability to provide appropriate monetary accommodation.
In addition, after careful planning and public communication, last October the FOMC began to gradually and predictably reduce the size of the Fed's balance sheet. Reducing our securities holdings is another way to move the stance of monetary policy toward neutral. The balance sheet reduction process is going smoothly and is expected to contribute over time to a gradual tightening of financial conditions. Over the next few years, the size of our balance sheet is expected to shrink significantly.
At our meeting last month, the FOMC raised the target range for the federal funds rate by 1/4 percentage point, bringing it to 1-1/2 to 1-3/4 percent. This decision marked another step in the ongoing process of gradually scaling back monetary policy accommodation. The FOMC's patient approach has paid dividends and contributed to the strong economy we have today.
Over the next few years, we will continue to aim for 2 percent inflation and for a sustained economic expansion with a strong labor market. As I mentioned, my FOMC colleagues and I believe that, as long as the economy continues broadly on its current path, further gradual increases in the federal funds rate will best promote these goals. It remains the case that raising rates too slowly would make it necessary for monetary policy to tighten abruptly down the road, which could jeopardize the economic expansion. But raising rates too quickly would increase the risk that inflation would remain persistently below our 2 percent objective. Our path of gradual rate increases is intended to balance these two risks.
Of course, our views about appropriate monetary policy in the months and years ahead will be informed by incoming economic data and the evolving outlook. If the outlook changes, so too will monetary policy. Our overarching objective will remain the same: fostering a strong economy for all Americans--one that provides plentiful jobs and low and stable inflation.
1. See the FOMC's Statement on Longer-Run Goals and Monetary Policy Strategy, amended effective January 30, 2018, available on the Board's website athttps://www.federalreserve.gov/monetarypolicy/files/FOMC_LongerRunGoals.pdf. Return to text
2. This fundamental uncertainty has been extensively studied, particularly with respect to the most commonly used measure of full employment--the so-called natural rate of unemployment. The authors of one well-regarded study concluded that even when using sophisticated statistical techniques, the natural rate of unemployment could be as much as 1-1/2 percentage points above or below their point estimate. See Douglas Staiger, James H. Stock, and Mark W. Watson (1997), "How Precise Are Estimates of the Natural Rate of Unemployment? (PDF)" chapter 5 in Christina D. Romer and David H. Romer, eds., Reducing Inflation: Motivation and Strategy(Chicago: University of Chicago Press), pp. 195-246. Return to text
3. Individuals expecting to be recalled from a temporary layoff are also counted as unemployed whether or not they are actively looking for work. Return to text
4. The official unemployment rate is known as U-3. Return to text
5. These data are from the Bureau of Labor Statistics' Job Openings and Labor Turnover Survey, or JOLTS, and start in 2000. Return to text
6. For disability transition rates, see Ernie Tedeschi (2018), "Will Employment Keep Growing? Disabled Workers Offer a Clue," The Upshot, New York Times, March 15. Return to text
7. Wolters Kluwer (2018), Blue Chip Economic Indicators, vol. 43, no. 3 (March 10). Return to text
8. See, for example, Robert J. Gordon (2016), The Rise and Fall of American Growth: The U.S. Standard of Living since the Civil War (Princeton, N.J.: Princeton University Press). Return to text
9. See, for example, Ryan A. Decker, John Haltiwanger, Ron S. Jarmin, and Javier Miranda (2016), "Declining Business Dynamism: What We Know and the Way Forward," American Economic Review, vol. 106 (May), pp. 203?07. Return to text
10. See, for example, Erik Brynjolfsson, Daniel Rock, and Chad Syverson (2017), "Artificial Intelligence and the Modern Productivity Paradox: A Clash of Expectations and Statistics," NBER Working Paper Series 24001 (Cambridge, Mass.: National Bureau of Economic Research, November). Return to text
11. See, for example, Katharine G. Abraham and Melissa S. Kearney (2018), "Explaining the Decline in the U.S. Employment-to-Population Ratio: A Review of the Evidence," NBER Working Paper Series 24333 (Cambridge, Mass.: National Bureau of Economic Research, February). Return to text
12. See Alan B. Krueger (2017), "Where Have All the Workers Gone? An Inquiry into the Decline of the U.S. Labor Force Participation Rate," Brookings Papers on Economic Activity, Fall, pp. 1-87. Return to text
