子夜讀書心筆
寫日記的另一層妙用,就是一天辛苦下來,夜深人靜,借境調心,景與心會。有了這種時時靜悟的簡靜心態, 才有了對生活的敬重。


See parts I and II.
Co-written by Patrick Kirts
S&P 500 analysts’ as reported trailing twelve-month (ttm) top-down EPS estimates suggest that the index is incredibly overvalued. In Q2 2009 they predict slightly negative earnings, and then slightly positive earnings in Q3, which, at April 9’s closing price of $855.56, would mean a P/E below negative 450, and then above 1900. By this measure, stocks are not cheap; they are at an all-time premium! Evidently, this is not the metric that best explains the current rally.
Now, I know what you may be thinking (other than the market is overpriced!), that you can’t include banks and their losses into the picture. However, we would argue that leaving out the banks or smoothing out earning over the past 5 years hides the fact that the easy money created by the banks themselves helped corporate earnings across the board. We are still long stocks and know the market is not overpriced like a dot.com, but to say we are at a 12 to 15 P/E is not telling the whole story.
If the ttm EPS were accepted as the correct measure of a stock’s value, then we would anticipate a large sell-off come summer. But investors do not seem to be paying attention to this statistic, although it has been reliable in the past. The S&P fell about 42% from late August to its November low, in anticipation of global economic contraction, and particularly large paper losses for financial firms, which were the main driver of the Q4 as reported EPS loss. 2008 as reported EPS fell almost 77% from 2007, and operating EPS fell 40%, and we should keep in mind that financials fell more steeply than anything else.
Nevertheless, if ttm as reported EPS is not useful because of its coming dislocation, is there some other measurement of P/E that might shed some more light on the current market?
Twelve month forward as reported EPS estimates might do nicely as a metric. The chart below compares the latter earnings metric with the former, and their respective P/Es (with the trailing P/E reduced by a factor of 10); we see that 2009’s estimates hover safely in the 25-30 range. It would make sense for this rally to be fueled by an expected earnings recovery.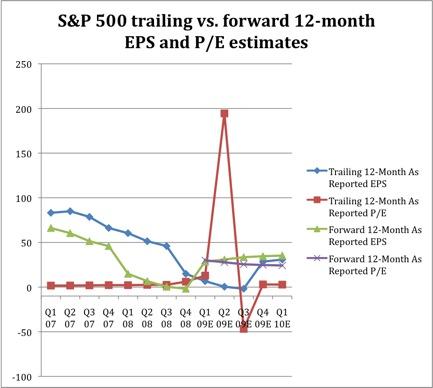
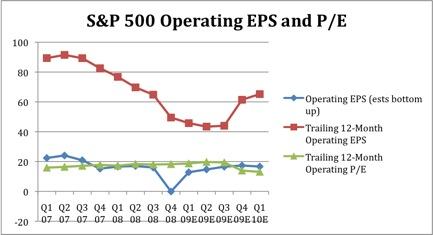
Because of the seeming correlation between the S&P 500 price drop and the fall in operating earnings, we might also investigate operating EPS estimates (ttm, bottom-up). The chart below shows that real operating losses were not nearly as significant, and nothing approaching negative ttm earnings is possible.
Also, the P/E has not budged from 15-20 in over two years, and is expected to continue to be in this range, so there is little evidence that purchasing a claim on operating earnings has gotten any cheaper, although it hasn’t gotten more expensive, either.
The S&P 500 is now about $900. Using our forward as reported EPS estimate, the P/E is about 31.6. Using the operating earnings, the P/E is about 19.7. Both are within the normal range.
Unfortunately, this means that the S&P 500 cannot be considered cheap at current valuations, and deviations from the analyst’s somewhat rosy earnings estimates could result in a resumption of downward price action.
Is this, perhaps, a paradigm case of selling optimism now to buy pessimism later?
We think raising some cash between May and November has some pretty good backing right now.
Disclosures: None mentioned.
