子夜讀書心筆
寫日記的另一層妙用,就是一天辛苦下來,夜深人靜,借境調心,景與心會。有了這種時時靜悟的簡靜心態, 才有了對生活的敬重。


James Cullen
In my previous article, I discussed three core questions used in company analysis that can be broadened to a more macro perspective:
- Are corporate strategies workable?
- Do companies have the balance sheet strength to execute on their strategies?
- Is investor sentiment poor enough to yield strong forward returns?
The third question was addressed already, but what about the others? Much attention is being given to those proclaiming an end to the world as it was, although I’ve yet to see much in the way of concrete advice as to what will replace it, beyond talk of less leverage. Less leverage will force companies to focus on driving a greater return on assets (ROA), instead of simply adding leverage to juice return on equity (ROE). So, how have large companies done in terms of earning large spreads over the asset base?
The chart below shows the average yearly ROA from current Dow Jones Industrial components over the last 10 years. Excluded from the calculations are Citigroup (C), JP Morgan (JPM), AIG (AIG), General Electric (GE), and General Motors (GM), leaving twenty-five companies. First, the following graph shows how the average ROA of those companies has trended over the last ten years.
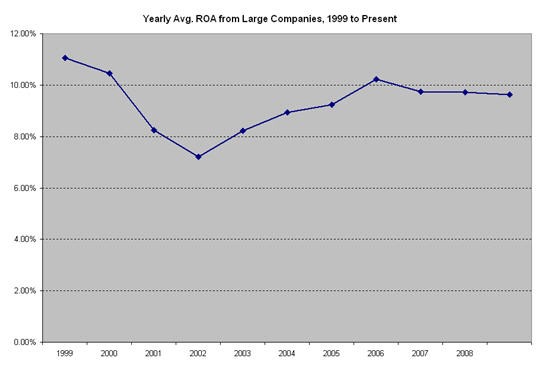
Overall, this shows a strong performance from firms primarily in consumer goods and industrial manufacturing. While there’s nothing to guarantee these kinds of results will persist, it’s worth recognizing that the underlying profitability of the largest non-financials is fairly strong; average ROA across the ten year sample was 9.31%. Even at the low point in 2002, average ROA was still in excess of 7%, meaning that even on a very conservative leverage ratio, trough ROE would still be in the double digits.
What kind of information is revealed on an individual company basis? One sorting process I ran looked at the standard deviations of both ROA and leverage ratio (multiplied together, they give ROE), and compared the standard deviation of each to their respective mean. I then ranked the companies in each category, with the top company being the one with the lowest standard deviation relative to mean; the company with the best blended results came out on top, and so on down to the lowest overall ranked company, which displayed the most variation in ROA and leverage over the ten year time frame. This process was also repeated giving twice the weight to ROA as leverage, under a hypothesis that the market might value asset spread consistency more than leverage stability, but the results were not as robust, so I’ve excluded them (for now).
![]()
I’ll let readers draw their own conclusions as to whether or not the list is full of surprises. Wal-Mart (WMT), a long-time favorite, tops the list and has posted exceptional relative returns. The real purpose was to see what correlation, if any, existed between the stability of trailing results and stock price performance between the October 2007 market top and the March 2009 bottom, as well as performance in the six weeks or so since that early March bottom.
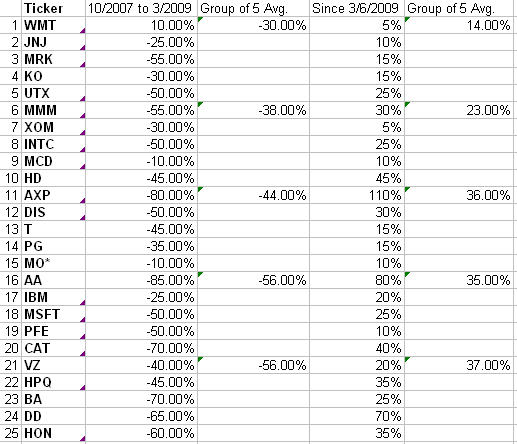
By breaking the twenty-five stocks into five groups of five and looking at average returns, it’s easy to see the differences in performance between more stable firms and those with more volatile results. As the market was pushing lower, those with more stable historical profitability outperformed; when the market turned, risk appetites pushed the most beaten-up (and vulnerable) stocks higher.
So if leading American businesses have been doing fine in terms of generating returns over the last decade, why is the Dow Jones Industrial Average (to pick one) down 20% in that time? I think this goes back to what was addressed last time, which is that investors had competed away most of the returns available in prior periods, now, risk assets have been repriced and actually offer reason for optimism about future performance. One simple model I use as a proxy for forward returns shows that expected returns for the twenty-five stocks above were upside down (negative) relative to 10-year Treasuries in 1999; the spread has since widened to the present gap of nearly 7%, with expected forward returns from this group of large cap (admittedly, non-financial) equities at almost 10%.
Call me an optimist, but I tend to side with those who believe most large firms are fairly well run, and have adequate competitive positioning to do well over time. In the next piece, I’ll address whether or not companies will be around to see brighter days in the future, and what cost (if any) that will come to existing shareholders.
