


正文
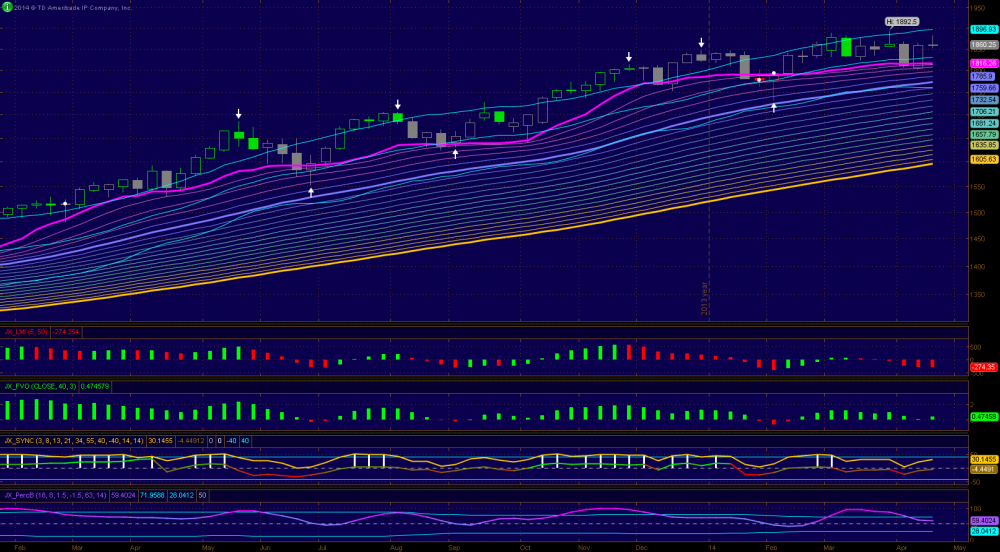
1. Weekly PL has been flat for a while now which suggests a trading range market. Since ES printed a weekly grey doji candle near the upper trading band, perhaps it is the time to think the lower end of this trading range now which is near 1750s. As I have preached many times before ES trading at 1750s will not change the overall long term trend. Weekly indicators are still bullish however momentum is decreasing. Overall weekly is range bound with bullish bias.
2. A pullback is ongoing in daily ES chart. ES touched the triple lines today and has found some support near lower 50s. There could be some downside pressure coming from the weekly doji candle and 30-40 support is critical for bulls; If bears can push through those support ES is likely to revisit 11 or go under 1800 this time around. Daily indicators are bullish.
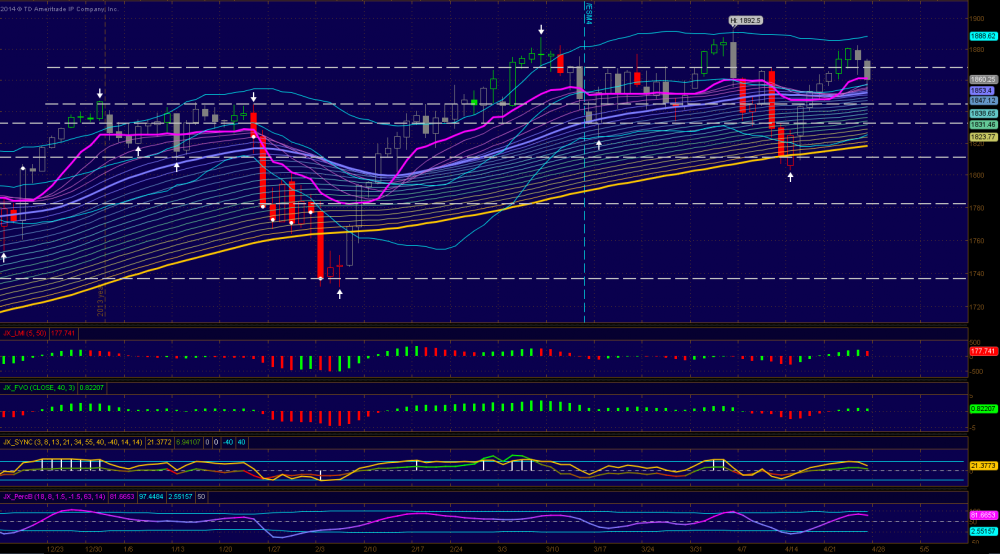
3. As I mentioned yesterday a close below 68.5 will lead to further weakness. This morning ES closed below 68.5 (1st red bar) and printed 3 red candles during the Regular hour. Now PL is pointing down and has crossed over TBL. Price has hovered around the TBL. Indicators are bearish and supports between 30-40 will be crucial for bulls if they are eyeing a new all time high.
4. Major Support Levels: 40-44, 30, 11, 1774, 1756 and 1730.
Weekly
Daily
3-Hour

2. A pullback is ongoing in daily ES chart. ES touched the triple lines today and has found some support near lower 50s. There could be some downside pressure coming from the weekly doji candle and 30-40 support is critical for bulls; If bears can push through those support ES is likely to revisit 11 or go under 1800 this time around. Daily indicators are bullish.
3. As I mentioned yesterday a close below 68.5 will lead to further weakness. This morning ES closed below 68.5 (1st red bar) and printed 3 red candles during the Regular hour. Now PL is pointing down and has crossed over TBL. Price has hovered around the TBL. Indicators are bearish and supports between 30-40 will be crucial for bulls if they are eyeing a new all time high.
4. Major Support Levels: 40-44, 30, 11, 1774, 1756 and 1730.
Weekly
Daily
3-Hour

評論
cat18
2014-11-03 11:10:45
回複
悄悄話
so sad, God bless him in heaven
soloman
2014-11-03 11:09:47
回複
悄悄話
R.I.P.
地生_2006
2014-11-03 11:06:40
回複
悄悄話
I am so sad that you are leaving us. R.I.P. I appreciate what you have done for us. Thanks a lot.
10things
2014-05-01 05:37:13
回複
悄悄話
no more updates??
10things
2014-04-28 07:45:38
回複
悄悄話
thanks
CCCCCC2010
2014-04-27 19:46:13
回複
悄悄話
Thanks
登錄後才可評論.